What is Business Intelligence (BI)?
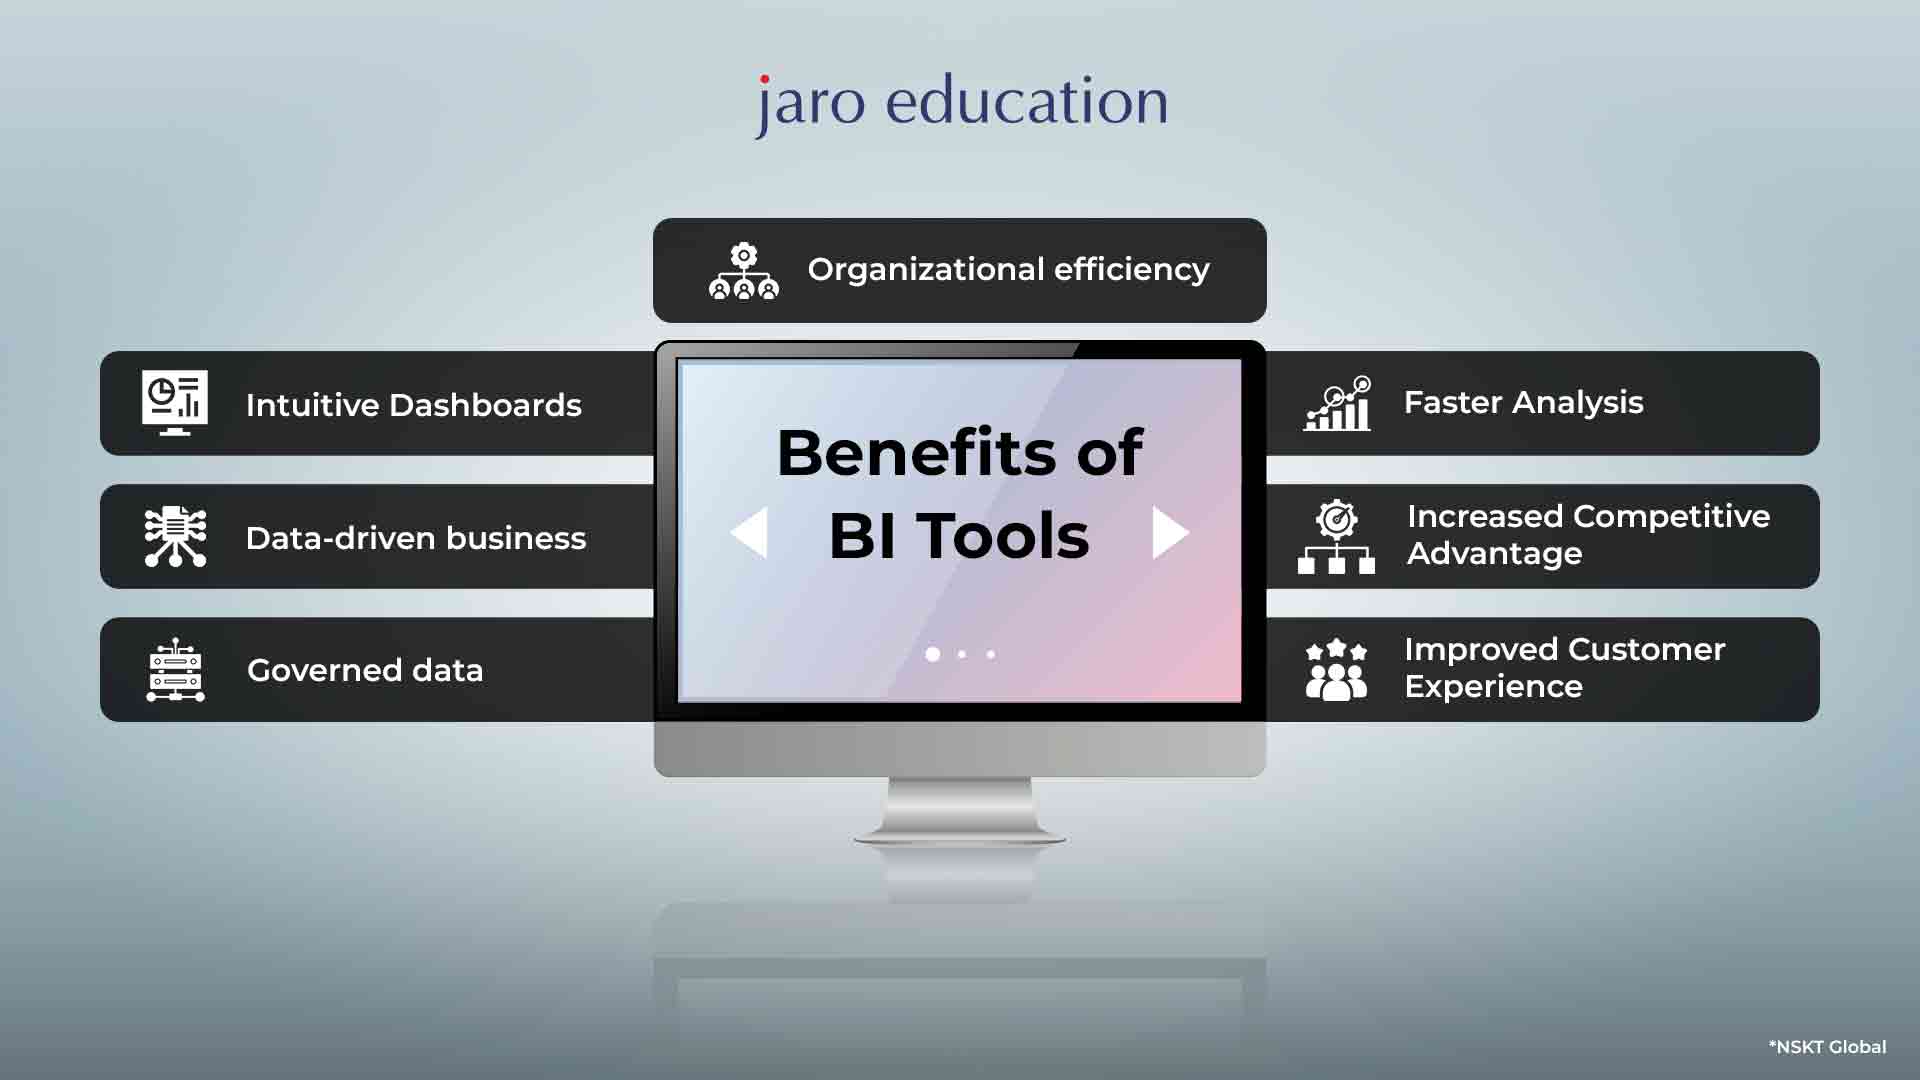
This is a commonly raised question by people interested in business analytics and related topics. It is a process driven by technology that analyses data and delivers actionable information. This process combines different business intelligence tools to help workers, executives, and managers to make informed decisions. Business intelligence tools or BI tools connect users to the raw data, allowing them to analyse, model and report on diverse data effortlessly. These tools, through visualisation and automation, ought to enhance the decision-making processes and give a better knowledge of an organisation’s key metrics sources of those indicators.
If you are keen to learn about business analytics and different business intelligence platforms, then you can take part in the Executive Program in Business Analytics at the Adani Institute of Digital Technology Management. This is a one-year program where candidates can learn about different business intelligence tools and programming languages. Register with Jaro Education to get further details about this course.
Choosing the right business intelligence (BI) tool
Various business intelligence tools are available that help people in an organisation make informed decisions. However, anyone assigned to choose a BI tool must check the product features and conduct market research. To find the right tool, people should also check whether the product features align with the business requirements.
The size and growth of a company are also important factors to consider when choosing a BI tool. For instance, lightweight tools and cheaper software are appropriate for a small enterprise to manage less data variety and volume.
Another important aspect is use cases. For instance, a logistics organisation may prioritise different BI features than a digital marketing company more concerned with gathering information or evaluating user engagement.
Table of Contents
When training new users, a simple business intelligence tool with fewer features will be easy to learn and more economical. If an end-user is well-versed in BI technology, then more sophisticated business intelligence tools are appropriate.
Many organisations find difficulties in analysing data due to the underlying ETL/ELT procedures’ quality and the amount of data warehouse integration. For this, the centralised repository should be an accessible, consolidated and accurate data source. In fact, when choosing the right BI tool, it is not necessarily selecting the best technology but rather ensuring that the operational data systems are reliable from the start.
Groups of business intelligence tools
- Analyst-focused business intelligence tools
- Business-user-focused business intelligence tools
Analyst-focused business intelligence tools
As the name suggests, analyst-focused BI tools are used by the analytics team. These tools empower the analytics team to be data explorers rather than becoming database maintainers. In cases when business users are unable to know the appropriate questions, data analysts inquire more thoroughly using programming languages like Python, SQL or R.
*NSKT Global
Business-user-focused BI tools
To make the statistics queryable for business users, business-focused BI tools require some initial setup. After the technical setup, a few technical skills are required daily. These tools enable business stakeholders like marketing heads to create actionable insights and analyses without writing SQL (Structured Query Language). To facilitate this, business-focused BI tools include more comprehensive end-user skills like calculated fields, drill-downs, filtering and drag-and-drop, as well as a user-friendly interface.
Popularly used business intelligence tools
As mentioned in the previous sections, there are various business intelligence tools to choose from. Some of the well-known BI tools are documented below.
Looker
A BI tool, Looker, is oriented toward providing business users with the capacity to perform self-service analytics. It is a transparent and highly sophisticated tool that uses an intermediate data modelling layer to establish business metrics once and then reuse them across the organisation. Though the tool is coded in LookML, a SQL-like language that facilitates debugging and version control, the business team needs to learn a new coding language. It requires a lot of work for Looker to get the business user up and performing fast.
By using data modelling after an analytics team has set up the environment, business users can create their own drag-and-drop studies and examine data using visualisation tools without significant Looker training. Each drag-and-drop analysis generates a SQL query that describes what’s going on under the hood. Looker is suitable for mid-market and enterprise companies. Business users across the organisation can use this with the support of a data analytics team.
Tableau
Tableau is a sophisticated BI tool with powerful analytics features and data visualisation. It is recognised to offer best-of-class visualisations to all sorts of business end-users. To generate dashboards and detailed analytics, Tableau’s drag-and-drop interface is used. However, those using the tool for the first time require extensive training. The tool can query, visualise and connect data without coding. Furthermore, this BI tool can set subscriptions and alerts for reports users can share across organisations. Like Looker, Tableau is also a good fit for enterprise companies and mid-size markets. Furthermore, business users with data analytics team support handle this tool.
Mode
Mode is very technical as a BI tool when it comes to analytics powerlifting. The tool is simple-to-easy and easy to set up, which makes it an excellent choice for both small and medium businesses. Mode’s HTML editor enables customers to incorporate a white-label version in their site and complete access to a personalised event. The tool queries data using Python, SQL and R. Mode utilised white label to integrate custom and interactive applications into the given application. With this tool, users can also visualise data with interactive reports and share it across the organisation. Data scientists and SQL analysts of small and medium-sized businesses use this BI tool.
Periscope Data
Focused on both data analysts and data scientists, Periscope Data is a BI tool that enables users to query using programming languages like SQL, R and Python. This tool is a perfect fit if the organisation is data-driven and has the resource to set up an ETL (Extract, Transform and Load) warehouse and pipeline. It combines hosting, data connections, and visualisation layers all in one. Periscope Data additionally provides integrated capability and a high level of visualisation control and customisation.
Data caching (putting client data into multi-tenant Redshift clusters) by Periscope Data allows for substantially quicker queries. This tool further lets users create rich visualisations and share dashboards, explore different data resources and perform basic aggregations and calculations. With Periscope Data, organisations can save, run, and share analyses in seconds over billions of data rows. This tool is used by analysts of small and medium-sized businesses.
Microsoft Power BI
The business analytics tool Microsoft Power BI is a web-based tool suite that offers a collection of apps, software services, and connectors that simultaneously work to transform unrelated data into visually immersive, coherent, and interactive data. It enables users to discover patterns in real-time and includes fresh and new connections that allow them to step up their advertising game. Because it is web-based, Microsoft Power BI is accessible from any virtual location. Users may use this BI tool for app integration and sharing real-time dashboards, and giving analytical reports.
Zoho Analytics
For detailed reporting and data analysis, Zoho Analytics can be a great business intelligence tool. This BI tool supports automated data synchronisation and can be scheduled regularly. Using the integration APIs, you can quickly create a connection. By blending and merging data from many sources, analysts can create relevant reports. You may dig into the crucial information by creating customised reports and dashboards with a simple editor. It also has a distinct comments box in the sharing choices, which is ideal for partnerships.
Oracle BI
This BI tool is an application suite for enterprises. It provides customers with nearly all business intelligence features, including ad hoc reporting, dashboards, proactive intelligence, and more. Since Oracle is a very resilient solution, it is also ideal for businesses that need to examine massive amounts of data (from both Oracle and non-Oracle sources). Other important aspects of Oracle BI are versioning, alerts/notifications, data archiving and a self-service portal.
SAP Business Objects
This is a business intelligence tool that provides extensive reporting, interactive data visualisation, and analysis. The platform focuses mainly on Customer Experience (CX), digital supply chain, CRM, and ERP. The self-service, role-based dashboards it provides allow users to create their own dashboards and apps. It is the most appealing feature of this tool. SAP Business Objects is a sophisticated programme designed for IT, end users, and management roles and provides a plethora of features on a single platform.
Domo
Domo is a completely cloud-based business intelligence tool that combines data from social media, spreadsheets, and databases. The tool is utilised by both small businesses and huge global corporations. It provides visibility and analysis at the micro and macro levels (including predictive analysis powered by Mr. Roboto, their AI engine). From cash balances and area-specific lists of your best-selling items to marketing ROI estimates for each channel, this tool has multiple utilities. However, it has some drawbacks, including difficulties in obtaining cloud analytics for personal use and a high learning curve.
SAS Business Intelligence
This BI tool is most popular for providing powerful predictive analytics services. It also offers a fantastic business intelligence platform. The well-established self-service technology, which was launched in the 1970s, enables users to make educated business decisions by using data and analytics. SAS provides users with numerous customisation choices via their API set and offers high-level data integration. It also offers comprehensive analytics and reporting. The tool provides a seamless text analytics option for gaining contextual insights into your data.
Final Thoughts
Business intelligence tools are extremely adaptable and may offer you a wealth of important information about a company’s current and future prospects. While choosing the right BI tool, users should consider who will be doing the initial set-up, as whoever handles the tool shall be equally well-versed in SQL.
To get a complete idea of business intelligence tools and analytics, consider enrolling on the Executive Program in Business Analytics at the Adani Institute Of Digital Technology Management. This course is conducted via online classes where you will learn various programming languages to write codes using business intelligence tools like Tableau, Microsoft Power BI, Apache Spark, and lots more. With 150 hours of real-life assignments and projects, this program offers beyond classroom learning experience.


