

- jaro education
- 11, June 2024
- 4:00 pm
Maintaining data in an accessible format involves organizing, sorting, and manipulating it to derive meaningful insights.
Descriptive analysis plays a critical role in statistical data examination, enabling conclusions about data distribution, error identification, and outlier detection. It facilitates the recognition of patterns among variables, laying the groundwork for future statistical inquiries.
In this blog, we will deep dive into the fundamentals of descriptive analysis and with practical examples for researchers.
Understanding Descriptive Analysis
Table of Contents
Descriptive analytics is one of the methods of data analysis that involves utilizing current and past data to recognize patterns and correlations. This process is often referred to as the most straightforward type of data analysis because it highlights trends and relationships without delving into deeper insights.
Descriptive analytics is quite accessible and is likely used regularly within your organization. Fundamental statistical tools like Microsoft Excel, as well as data visualization platforms such as Google Charts and Tableau, can aid in data parsing, trend identification, relationship analysis, and visual data representation.
This type of analytics is particularly valuable for illustrating changes over time and serves as a starting point for more in-depth analysis that supports decision-making.
Examples of Descriptive Analysis
1. Traffic and Engagement Reports
Descriptive analytics involves reporting on engagement metrics like social media analytics or web traffic. This type of reporting uses raw data from user interactions to compare current metrics with historical data and visualize trends.
For example, if you’re tasked with analyzing traffic sources to your company’s product page, descriptive analytics can show which media channels are driving the most traffic. By comparing traffic data over time, you can update your team on changes, such as a 30% increase in traffic from paid advertisements year over year.
Other analytics types can then be used to delve into why traffic from different sources changed, predict future trends, and determine the best course of action.
2. Financial Statement Analysis
Financial statement analysis is another example of descriptive analytics. Income statements, Balance sheets, and cash flow statements provide a comprehensive view of a company’s financial well-being.
This analysis can be vertical (comparing items within a statement), horizontal (comparing items over time), or ratio-based (comparing items across periods or to industry standards). These methods reveal trends and relationships between variables based on current and historical financial data.
3. Demand Trends
Descriptive analytics can identify customer preference trends and predict demand for products or services. For example, Netflix uses descriptive analytics to track user behavior and determine trending TV series and movies for its platform’s home screen.
Understanding trends helps in decision-making for content creation, contracts with production companies, and marketing strategies.
Data analysis is a vast field that includes various methods and techniques. If you’re interested in a data science career, consider the Advanced Data Science Certificate Program offered by the Rotman School of Management (University of Toronto) and IITM Pravartak Technology Innovation Hub of IIT Madras. This program is designed for individuals wanting to enhance their career in data science field. By enrolling in this course, once can gain proficiency in data analytics tools and techniques, taught by top-notch faculty of Rotman School of Management and IITM Pravartak.
Types of Descriptive Analysis
Descriptive analysis uses different methods to understand data in practical ways. One common method involves using basic statistics like means, medians, and modes to show important trends and variations in the data.
A descriptive researcher’s job is to simplify the data so it’s helpful to others. This doesn’t mean every detail is equally important. Instead, the focus is on highlighting the most important parts of the phenomenon, considering the real-life context in which the research is meant to be applied.
The four types of descriptive analysis methods are:
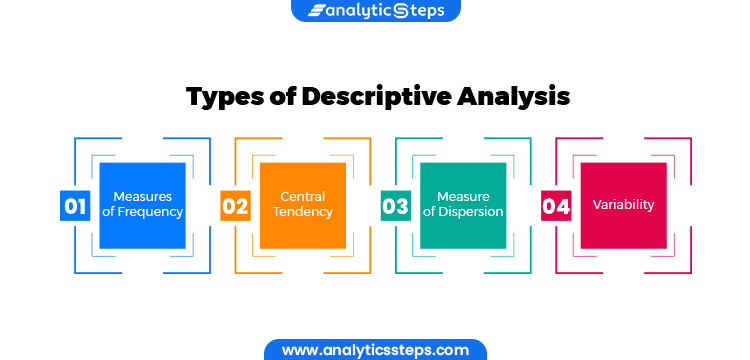
Central Tendency Measures:
Central tendency measures are used to describe the typical or central value of a dataset. Some commonly used measures include:
-
- Mean: This is the average value obtained by adding up all values in a dataset and then dividing by the total number of values. For example, consider a dataset of exam scores: 80, 85, 90, 75, 88. The mean score = (80 + 85 + 90 + 75 + 88) / 5 = 83.6.
- Median: This is the middle value when the dataset is arranged in ascending order. For the same exam scores dataset: 75, 80, 85, 88, 90. The median score = 85.
- Mode: This is the value that appears most frequently in the dataset. In the exam scores dataset, there is no mode as each value appears only once.
Variability Measures:
These measures indicate the spread or dispersion of data points around the central value. Common variability measures include:
-
- Range: It defines the difference between the maximum and minimum values in the dataset. Using the exam scores dataset: Range = Maximum score – Minimum score = 90 – 75 = 15.
- Variance: This measures the average squared deviation from the mean. It indicates how much the values in a dataset vary from the mean.
- Standard Deviation: This is the square root of the variance, which measures the average distance of data points from the mean.
Frequency Distribution:
Frequency distribution involves organizing data into groups or intervals and showing how often certain values occur within each group. Here’s an example:
For instance, we ask people their ages in a survey and want to see how ages are spread among respondents. We can group ages into ranges like 20-29, 30-39, 40-49, and so on. Then, we count how many people fall into each age range. This way, we can create a picture of age distribution and spot which age group most people belong to.
Correlation Analysis:
Correlation analysis examines the relationship between two or more variables to determine how they are related and to what extent changes in one variable are associated with changes in another. Commonly used measures of correlation include the Pearson correlation coefficient (for linear relationships) and Spearman’s rank correlation coefficient (for monotonic relationships). Here’s an example to illustrate correlation analysis:
Suppose we want to study the relation between study hours and exam scores. We collect data on study hours (in hours per week) and corresponding exam scores (out of 100) for a group of students. By calculating the Pearson correlation coefficient between study hours and exam scores, we can determine if there’s a statistically significant correlation (positive, negative, or none) between these variables. A positive correlation would suggest that higher study hours are associated with higher exam scores, while a negative correlation would suggest the opposite.
Graphical Methods:
Graphical methods in descriptive analysis involve representing data visually using graphs and charts to provide insights and facilitate data interpretation. Some common graphical methods include:
- Histograms: Used to represent the frequency distribution of continuous data by dividing data into bins or intervals and showing the number of data points in each bin.
- Pie Charts: Useful for representing parts of a whole, where each category is shown as a slice of the pie, proportional to its contribution to the whole.
- Scatter Plots: Used to visualize the relationship between two variables, with one variable plotted on the x-axis and the other on the y-axis. Each data point represents the values of both variables for an individual observation.
- Box Plots (Box-and-Whisker Plots): Display the distribution of a dataset along with its median, quartiles, and outliers. They provide a summary of the data’s central tendency, variability, and skewness.
How To Conduct Descriptive Analysis
Conducting a descriptive analysis involves several systematic steps to summarize and interpret data. Here’s a guide to help you through the process:
Define Your Objectives:
Before starting any analysis, it’s crucial to have clear objectives in mind. This could involve understanding a specific phenomenon, identifying trends, or making comparisons. For example, if you’re analyzing customer satisfaction data, your objective might be to identify key factors influencing satisfaction levels. Knowing your objectives helps in focusing the analysis and selecting appropriate methods.
Data Collection:
Gathering relevant data from various sources is the next step. This could involve structured data from surveys, transaction records, or experimental data. The choice of data sources should align with your objectives and research questions. Ensuring the quality and completeness of the data at this stage is important for the accuracy of the analysis.
Data Cleaning:
Raw data often requires cleaning before analysis. This step involves identifying and rectifying errors, handling missing values (e.g., through imputation or exclusion), and ensuring consistency in data formats. Clean data is essential for meaningful analysis and prevents biases or inaccuracies in results.
Data Exploration:
Exploratory data analysis (EDA) involves examining the dataset visually and statistically to understand its underlying patterns and characteristics. This can include generating summary statistics, plotting histograms or scatter plots, and identifying outliers or anomalies. EDA provides insights into the distribution and structure of the data, aiding subsequent analysis decisions.
Choose Descriptive Statistics:
Based on the nature of the data and objectives, select appropriate descriptive statistics to summarize key aspects. This could involve measures of central tendency (mean, median, mode), variability (range, variance, standard deviation), or frequency (counts, percentages). The choice of statistics depends on the variables being analyzed and the insights sought.
Calculate Descriptive Statistics:
Once chosen, calculate the selected descriptive statistics using statistical software or tools. Accuracy in calculations is crucial for drawing reliable conclusions. Tools like Excel, Python, or statistical software packages (e.g., SPSS, R) facilitate accurate computation of these statistics.
Interpret the Results:
Analyze the calculated statistics to draw meaningful insights. Interpretation involves identifying trends, relationships, or significant findings within the data. This step bridges the gap between raw data and actionable insights, aiding decision-making processes.
Report Findings:
Communicate the analysis findings effectively through a report or presentation. Use visual aids such as tables, charts, or graphs to summarize complex information and make the results accessible to stakeholders. Clarity and conciseness in reporting ensure that the key messages are conveyed accurately.
Review and Refine
Finally, critically evaluate the analysis process and outcomes. Consider if additional data or alternative methods could enhance the analysis. Iterative refinement may be necessary to ensure that the analysis aligns with the initial objectives and provides actionable insights for decision-making.
Advantages of Descriptive Analysis
1. Objectivity and Neutrality: Descriptive Analysis maintains a high degree of objectivity and neutrality among researchers, ensuring accurate representation of data characteristics and trends.
2. Comprehensive Insight: Compared to other quantitative methods, Descriptive Analysis offers a broader and more comprehensive view of events or phenomena by utilizing varying numbers of variables.
3. Reflects Natural Relationships: Descriptive Analysis portrays natural relationships and presents the world as it exists, making it authentic and closely aligned with real-life data behaviors.
4. Hypothesis Generation and Variable Identification: This method is valuable for identifying variables and generating new hypotheses, based on direct trends extracted from data properties, thereby minimizing errors.
5. Flexibility in Data Utilization: Researchers can leverage both quantitative and qualitative data, such as combining case studies and correlation analysis, to gain a deeper understanding of population characteristics.
6. Efficient Data Collection: Survey-based Descriptive Analysis allows researchers to gather data from large sample sizes, providing robust insights and conclusions compared to experimental studies.
Limitation of Descriptive Analysis
1. Inability to Make Predictions: Descriptive analysis cannot be utilized for making predictions based on the given data values. Unlike inferential statistics, which allows us to forecast future values through regression analysis, descriptive statistics simply describe the existing data without projecting into the future.
2. Time-Consuming Data Collection: The process of gathering data for descriptive analysis can be time-intensive and often requires substantial effort. For example, conducting surveys to collect data involves training and compensating interviewers, making it both time-consuming and expensive.
3. Lack of Causality: Descriptive analysis focuses on presenting data as it is, without investigating causal relationships. It does not explain why certain patterns or trends occur; it only describes what is observed.
4. Limited to Historical Data: Descriptive analytics mainly deals with historical data, offering insights into past events. While this is valuable for understanding trends, it does not address future scenarios or changes.
5. Weak Relationships with Other Data: Descriptive data often lacks strong connections with other data points. Researchers may need to infer these relationships, which can lead to incorrect conclusions and pose challenges in decision-making.
6. Potential for Misleading Interpretations: Improper execution of descriptive analytics can sometimes result in misleading conclusions. For instance, altering the scale of a graph can distort perceptions and mislead individuals not well-versed in statistics.
Conclusion
Businesses are using data more than ever to improve how they operate, from sales and finances to supply chains. In the future, data analytics will focus more on prescribing actions rather than just predicting outcomes.
Descriptive analytics looks back at what has happened and makes some guesses about the future. Imagine a GPS navigation system—it can analyze past routes and fuel use but can’t tell you the fastest route for your next trip or how to use less fuel.
For more proactive advice, organizations use predictive analytics. This method doesn’t just describe past events; it helps predict the best delivery routes based on factors like driver preferences and road conditions.
Descriptive analytics is an essential tool for understanding historical data and monitoring trends in business performance. But it’s just one part of a bigger analytics strategy. To get better insights, organizations should combine descriptive analytics with predictive, diagnostic, and prescriptive approaches. This mix helps predict outcomes more accurately and suggests ways to improve performance.
Trending Blogs