What is Descriptive Statistics?
Table Of Content
- Introduction
- Descriptive Statistics - Definition
- Types of Descriptive Statistics
- Measures of Central Tendency
Introduction
Descriptive statistics is a branch of statistics that provides summaries for either sample data or the population data. It is that branch of statistics that is used to define the characteristics of the known data. Inferential statistics is another branch of statistics that is concerned with making inferences about the population data. Descriptive statistics helps facilitate data visualisation and also presents it in a meaningful way that is easily understandable. Through this, a simplified interpretation of the data also becomes possible.
Descriptive statistics may not prove to be very efficient for decision making but it is still crucial to explain high-level summaries of a set of information such as variance, range, count of information, mean, median and mode.
This guide will help you learn what is descriptive statistics, its different types, benefits of descriptive data, the difference between descriptive and inferential statistics and how this tool is actually used to explore the data through examples of descriptive statistics.
Descriptive Statistics - Definition
What is descriptive statistics? To answer this question let us look at the definition. Descriptive statistics is defined as the category of statistics that are used to analyse and summarise a data sample’s characteristics through various quantitative techniques. To simplify it even more- descriptive statistics helps to summarise the features of a sample data either quantitatively or visually. This tool presents precise and simple-to-understand summaries and observations of the sample using measures like mean, median, variance as well as graphs and charts. Apart from this, univariate descriptive statistics which is a subcategory of descriptive statistics is used to describe data containing only one variable while bivariate and multivariate statistics are used to describe data with multiple variables.
Descriptive statistics also helps in catching certain trends and patterns followed by sample data and also assists in organising this data in a more readable and manageable format.
Types of Descriptive Statistics
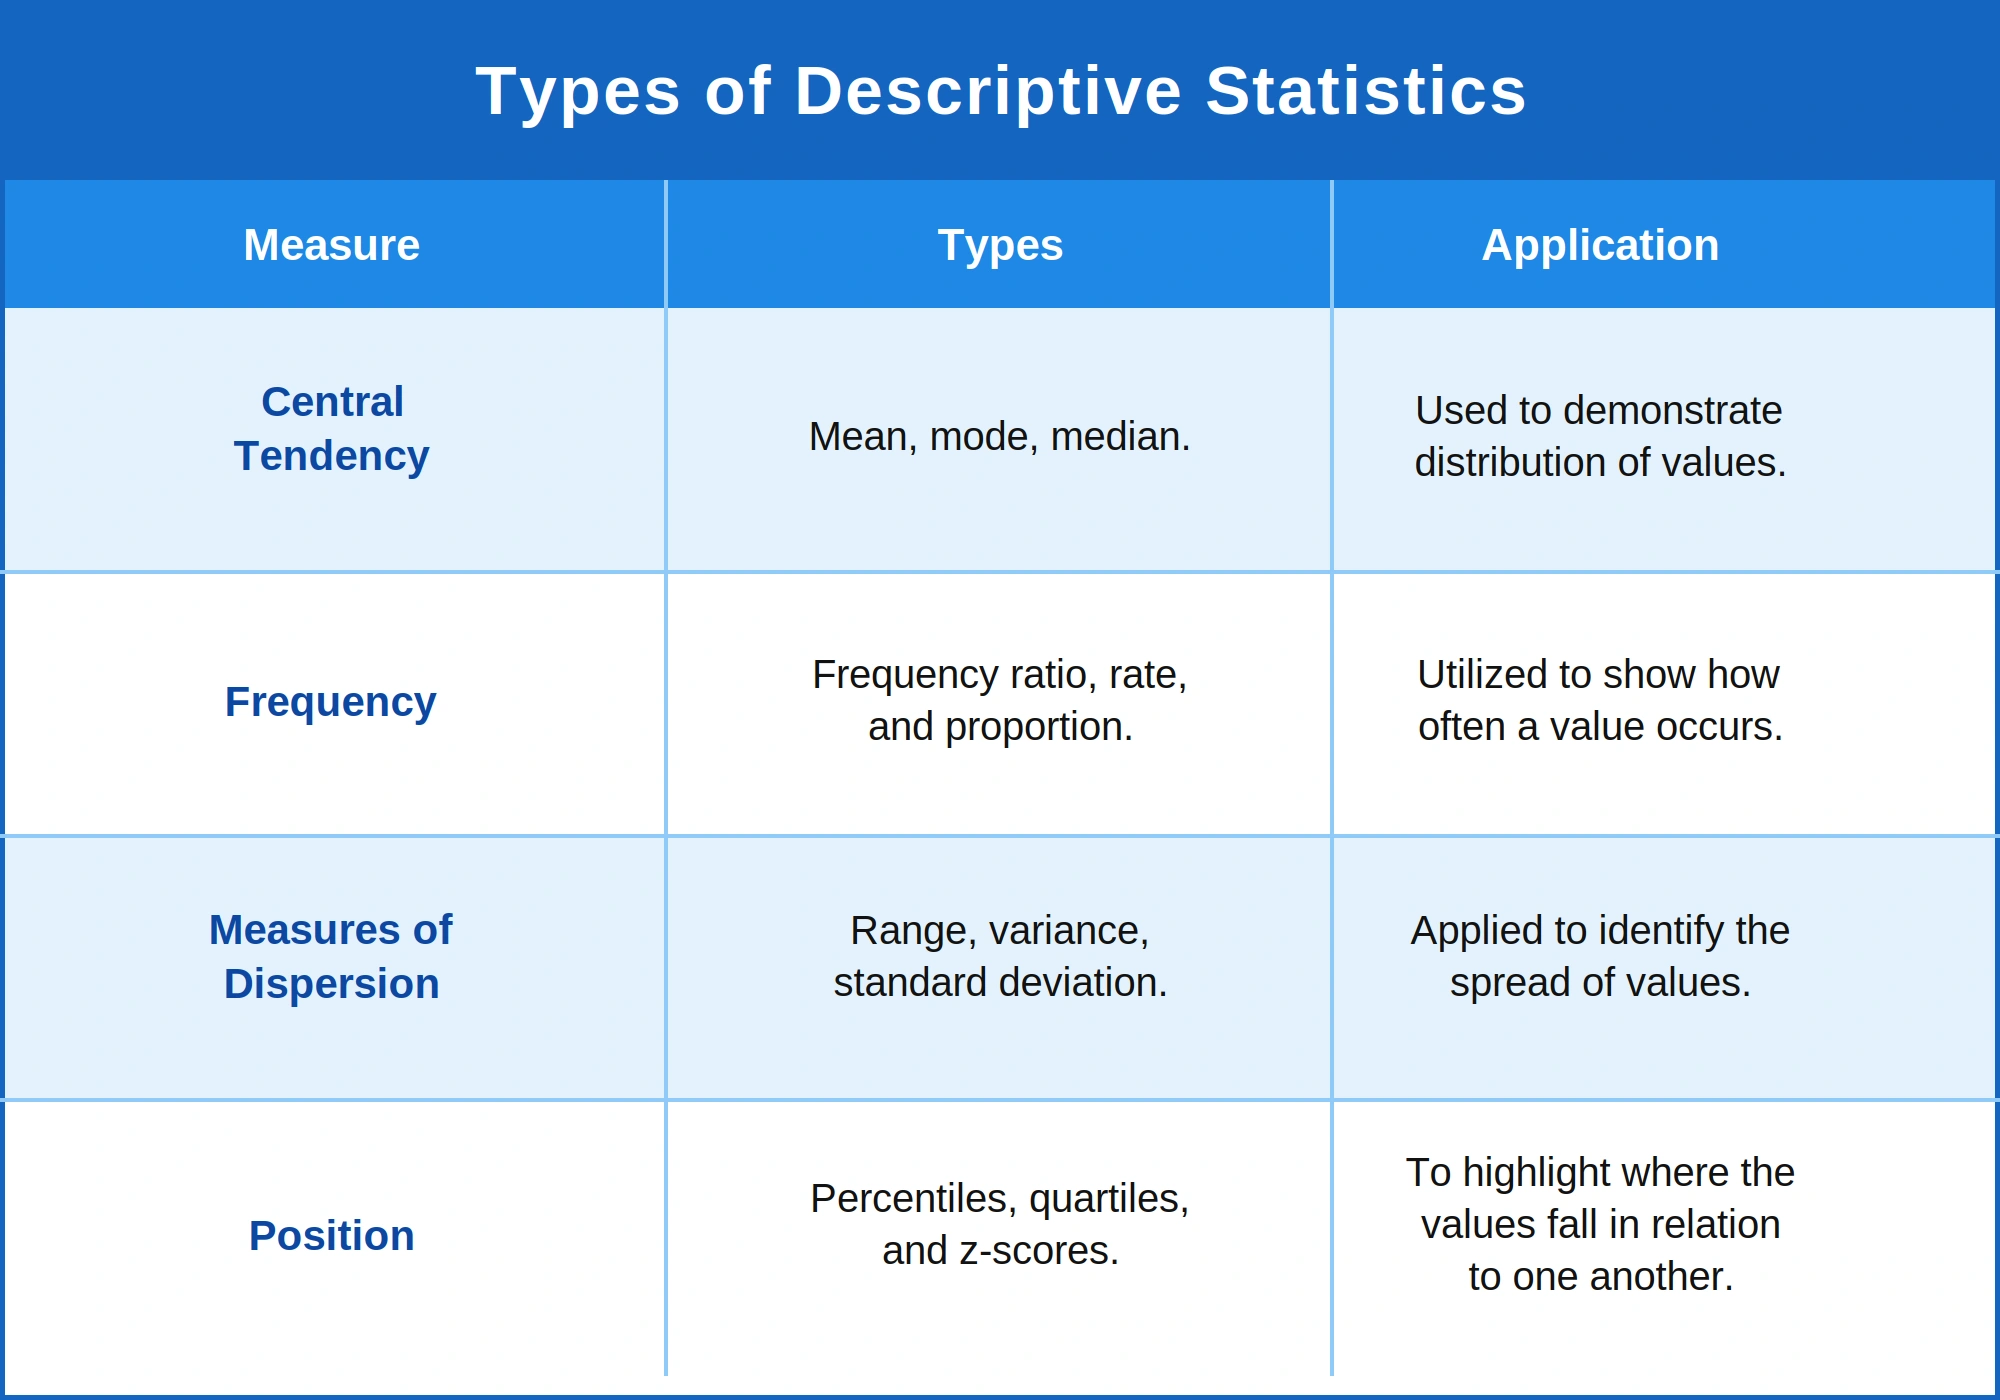
Frequency distribution, measures of central tendency and measures of dispersion are the three types of descriptive statistics that are used to summarise the characteristics of grouped as well as ungrouped data quantitatively. Ungrouped data is the raw data obtained after an experiment is conducted and once this data is organised logically it is known as grouped data. Descriptive statistics make use of graphs, charts and tables to visually represent data. Let us now look at the different types of descriptive statistics in detail.
Frequency distribution, measures of central tendency and measures of dispersion are the three types of descriptive statistics that are used to summarise the characteristics of grouped as well as ungrouped data quantitatively. Ungrouped data is the raw data obtained after an experiment is conducted and once this data is organised logically it is known as grouped data. Descriptive statistics make use of graphs, charts and tables to visually represent data. Let us now look at the different types of descriptive statistics in detail.
Frequency Distribution
Frequency distribution is a type of descriptive statistics that is used for qualitative as well as quantitative data and it is used to count the various outcomes in a data set or sample or to depict the frequency of these outcomes. Most of the time, frequency distribution is displayed with the help of tables or graphs. The table and graphs are filled with entries that are then followed by the frequency or count of the values’ occurrences in an interval, range or particular group.
To clarify frequency distribution even more, we can define it as a summary or presentation of grouped data that is categorised on the classes that are mutually exclusive and the number of occurrences in each respective class. This type of representation allows the raw data to be displayed in a more structured and organised way. Frequency distribution makes use of common charts and graphs like bar charts, histograms, pie charts and line charts for presentation of data.
Measures of Central Tendency
If you are wondering what descriptive statistics is, the central tendency type then worry no more we will help you understand it in detail. Central tendency is defined as the descriptive summary of a dataset that uses a single value reflecting the centre of data distribution. Measures of central location are another name for measures of central tendency. Mean, median and mode are the measures of central tendency. Let us take a look at what these three denote.
Mean
The most popular measure of central tendency. Mean is the most common or average value in a data set. It is the sum of all observations divided by the total number of observations. The formula for the same is given below:
Ungrouped data Mean: x̄ = Σxixi / n
Grouped data Mean: x̄ = ∑Mifi∑fi∑Mifi∑fi
- xixi- Stands for the ith observation
- MiMi- Stands for the midpoint of the ith interval
- fifi – Stands for the corresponding frequency
- n –Stands for the sample size.
Median
This is the middle score for a data set in ascending order. The formula is given below:
Ungrouped data Median (n is odd): [(n + 1) / 2]th term
Ungrouped data Median (n is even): [(n / 2)th term + ((n / 2) + 1)th term] / 2
Grouped data Median: l + [((n / 2) – c) / f] × h
- l – Stands for the lower limit of the median class given by n / 2
c – Stands for the cumulative frequency - f- Stands for the frequency of the median class
- h- Stands for the class height
Mode
This is defined as the most frequent score or value in a data set. The formula is given below:
Ungrouped data Mode: Most recurrent observation
Grouped data Mode: L + h (fm−f1)(fm−f1)+(fm−f2)(fm−f1)(fm−f1)+(fm−f2)
- L – Stands for the lower limit of the modal class
- H – Stands for the class height
- fm- Stands for the frequency of the modal class
- f1- Stands for the frequency of the class preceding the modal class
- f2 – Stands for the frequency of the class succeeding the modal class


Measures of Dispersion
This type of descriptive statistics is defined as a summary that displays the given samples’ degree of dispersion. To be more precise, the measure of dispersion determines how far apart the data points appear to fall from the centre. Variability, spread and dispersion- all three denote the range and width of distribution of values in a data set. Also, the range, standard deviation and variances are used to define the various components as well as aspects of the spread. Let us take a look at the important measures of dispersion and variability briefly:
Range
The difference between the highest and the lowest value. Let us take a look at the formula:
R= H-S
Here, S is the lowest value and H is the highest value in a data set.
Variance: The variability of the distribution with respect to the mean. The formula is:
Grouped Data Sample Variance, s2 = ∑f(Mi−¯¯¯¯¯X)2N−1∑f(Mi−X¯)2N−1
Grouped Data Population Variance, σ2 = ∑f(Mi−¯¯¯¯¯X)2N∑f(Mi−X¯)2N
Ungrouped Data Sample Variance, s2 = ∑(Xi−¯¯¯¯¯X)2n−1∑(Xi−X¯)2n−1
Ungrouped Data Population Variance, σ2 = ∑(Xi−¯¯¯¯¯X)2n∑(Xi−X¯)2n
- ¯¯¯¯¯XX¯ – Stands for mean
- MiMi- Stands for the midpoint of the ith interval
- XiXi- Stands for ith data point
- N- Stands for the summation of all frequencies
- n- stands for the number of observations
Standard Deviation
This is the square root of variance and it plays a very important role in the effective analysis of variability in a data set. The formula for the same is given below:
Standard Deviation: S.D. = √Variance = σ
Mean Deviation
Also known as absolute deviation- mean deviation gives the average of the absolute value of the data about the mean, median or mode. The formula is give below:
Mean Deviation = ∑n1|X−¯¯¯¯¯X|n∑1n|X−X¯|n
¯¯¯¯¯XX¯ – Stands for the central value.
Quartile Deviation
This is half of the difference between the third and first quartile. The formula is given below:
Quartile deviation = Q3−Q1/2
Benefits of Descriptive Statistics
The most important benefit of descriptive statistics is how easy and uncomplicated it makes the process of data visualisation. It helps in presenting the data in a more meaningful and understandable manner, which then makes the interpretation of data a simple process as well. Raw data is not easy to trend and analyse which makes the process of pattern determination challenging as well. Moreover, visualisation is difficult when you have raw data at hand. Let us understand this aspect of descriptive statistics with the example:
You have 50 pupil enrolled in a particular course. You need to analyse the performance of students taking the course and also need to distribute the marks. Without the help of descriptive statistics, marks will be taken as the raw data and that will make the task of marks distribution as well as determining the overall performance very challenging. This is where descriptive statistics must be used. Descriptive statistics will allow for the data to be summarised and presented in a structural manner using tabular and graphical descriptions.
Descriptive Statistics with Examples in Different Business Scenarios
As discussed above, descriptive statistics is able to communicate information in a quick manner. In the fast-moving world of corporate business, a person who is receiving data or information may not always have the time and the right skills or knowledge to analyse that data. This is why business analysts take up information and then reduce it to something that is easily understandable and characterised.
For example, a management team that is planning to make changes in the company’s strategy can take the descriptive statistics into account before coming up with modifications. With the help of descriptive statistics, managers can analyse whether the current plan is working and if course corrections are needed.
As for investors, descriptive statistics can offer an insight into a company’s value, finances, performance as well as growth potential while researchers use it to communicate and understand the details of the data sample they are using.
Representation of Descriptive Statistics
Let us take a look at the important forms of representations of descriptive statistics:
1. Graphs and charts
As discussed above graphs and charts allow the display of data in a visual format. They can be used to represent percentages, frequencies and distributions. Some examples of graphs used in descriptive statistics are bar graphs, pie charts and scatter plots.
2. Frequency distribution tables
These tables are used to display the distribution of values or classes along with the corresponding frequencies and they can be either simple or grouped. Frequency distribution tables are great for making charts as well as to find patterns in data analysis.
Difference Between Descriptive Statistics and Inferential Statistics
While both descriptive and inferential statistics are used to analyse and summarise the data the main difference is in the fact that descriptive statistics uses data quantitatively while inferential statistics uses these parameters to make inferences about the population. Let us look at the differences between descriptive statistics as well as inferential statistics below:
1. Descriptive Statistics
- Describes the characteristics of the population or the sample with the use of quantitative tools.
- It is used to display, define or describe the characteristics of a known dataset.
- The two most important types of descriptive statistics are measures of central tendency and measures of dispersion.
- Mean, median, variance, range, etc. are various measures of descriptive statistics.
2. Inferential Statistics
- Draw inferences about the population data from the sample data by using analytical tools.
- It tries to draw inferences about the population that goes beyond the known data.
- The two types of inferential data are regression analysis and hypothesis testing.
- z test, f test, ANOVA test, linear regression, etc. are measures of inferential statistics.
Keynotes on Descriptive Statistics
- Descriptive statistics is a branch of statistics that is used to display the features or characteristics of a population or sample with the use of quantitative analysis tools.
- Frequency distribution, measures of central tendency and measures of dispersion are the three most important types of descriptive statistics.
- Mean, mode, standard deviation, etc., are some measures of descriptive statistics.
- Descriptive statistics uses tables, charts and graphs to visually represent data.
Descriptive Statistics with Examples
- Example A
Finding the sample variance for the data given below
7,11,15,18,36,43
Solution:
Applying the sample variance formula:
s2 = ∑(Xi−¯¯¯¯¯X)2n−1∑(Xi−X¯)2n−1
Mean, ¯¯¯¯¯XX¯ = 21.67, n = 6
s2 = [(7 – 21.67)2 + (11 – 21.67)2 + (15 – 21.67)2 + (18 – 21.67)2 + (36 – 21.67)2 + (43 – 21.67)2] / 6 – 1
= 209.47
Therefore, the answer for this is s2 = 209.47
- Example C
Finding the median and the mean deviation about the median for the given data
9,10,12,16,17,18,20
Solution:
n=8
Applying the formula of median:
[(n / 2)th term + ((n / 2) + 1)th term] / 2
= [(8 / 2)th term + ((8 / 2) + 1)th term] / 2
= (4th term + 5th term) / 2
= (16 + 17) / 2 = 16.5
Applying formula of mean deviation about median:
= ∑n1|X−16.5|n∑1n|X−16.5|n
= [|9 – 16.5| + |10 – 16.5| + |12 – 16.5| + |16 – 16.5| + |17 – 16.5| + |17 – 16.5| + |18 – 16.5| + |20 – 16.5| ] / 8
= 3.125
Therefore, the answer is: Median = 16.5, Mean deviation about median = 3.125
Conclusion
We are living in a world that is brimming with data which makes communicating, understanding as well and interpreting data extremely crucial. We need to understand that descriptive statistics is not just used to crunch numbers, it is in fact a great tool that can draw narratives, visualise and also empower all of us to make informed decisions. Hopefully, this comprehensive guide gives you important insight into descriptive statistics. Through this guide, we helped you understand what descriptive statistics is, and its types namely measures of central tendency, measures of dispersion and frequency distribution, benefits of descriptive statistics as well as descriptive statistics with examples. By providing an insight into univariate and bivariate data, we have also tried to bridge the gap between individual characteristics and the dance between variables.
Frequently Asked Questions
The important formulas in descriptive statistics are:
- Median= [(n + 1) / 2]th term
- Mean= sum of all observations / number of observations
- Standard Deviation= √Variance
- Variance= ∑(Xi−¯¯¯¯¯X)2n−1∑(Xi−X¯)2n−1
Descriptive statistics is used in a lot of fields like computer science, health care and finance. Individuals working as data analysts, financial analysts, medical researchers, engineers, computer programmers as well as business analysts usually work with this area of mathematics.
- Accuracy measurement
- Error analysis
- Bias and variance analysis
- Statistical significance testing
- Performance comparison
- Confidence intervals
- Feature importance analysis
- Model validation
- Measures of central tendency: Mean, median and mode helps in drawing insights into where the centre of the data lies.
- Measure of dispersion: Range, variance and standard deviation is used to understand the spread of data and the pattern of its spreading
- Frequency distribution: With the help of bar charts, histograms and pie charts visualising the data distribution becomes easy.
- Correlation: With the help of correlation coefficients you can quantify the direction as well as strength of the relationship between variables.
- Scatter Plots: This type of visualisation can display the relationship between two variables, with each data point plotted on the graph.
- Regression Analysis: With this technique you can model the relationship between variables and can also predict the outcome of one based on the other.
- Visualisation: Bar charts, pie charts. histograms, graphs are used to visually represent the characteristics and distribution of data.
- Measures of central tendency: This includes the calculation of mean, median and mode to get an insight into the centre of the data distribution.
- Measures of dispersion: Variance, standard deviation and range helps us understand the spread or variability of data.
- Hypothesis testing: This technique involves drawing hypotheses about the characteristics of the population and using sample data to conclude whether these hypotheses are statistically important.
- Sampling techniques: Through this technique, inferential statistics makes valid inferences by carefully selecting representative samples from a population.
- Regression Analysis: This analysis is used to model relationships between predict outcomes and variables.
- Confidence intervals: This can provide a range of values within which a population parameter lies based on sample data.


Find a Program made just for YOU
We'll help you find the right fit for your solution. Let's get you connected with the perfect solution.

Is Your Upskilling Effort worth it?

Are Your Skills Meeting Job Demands?

Experience Lifelong Learning and Connect with Like-minded Professionals

