Learn the Fundamentals of Data Analytics
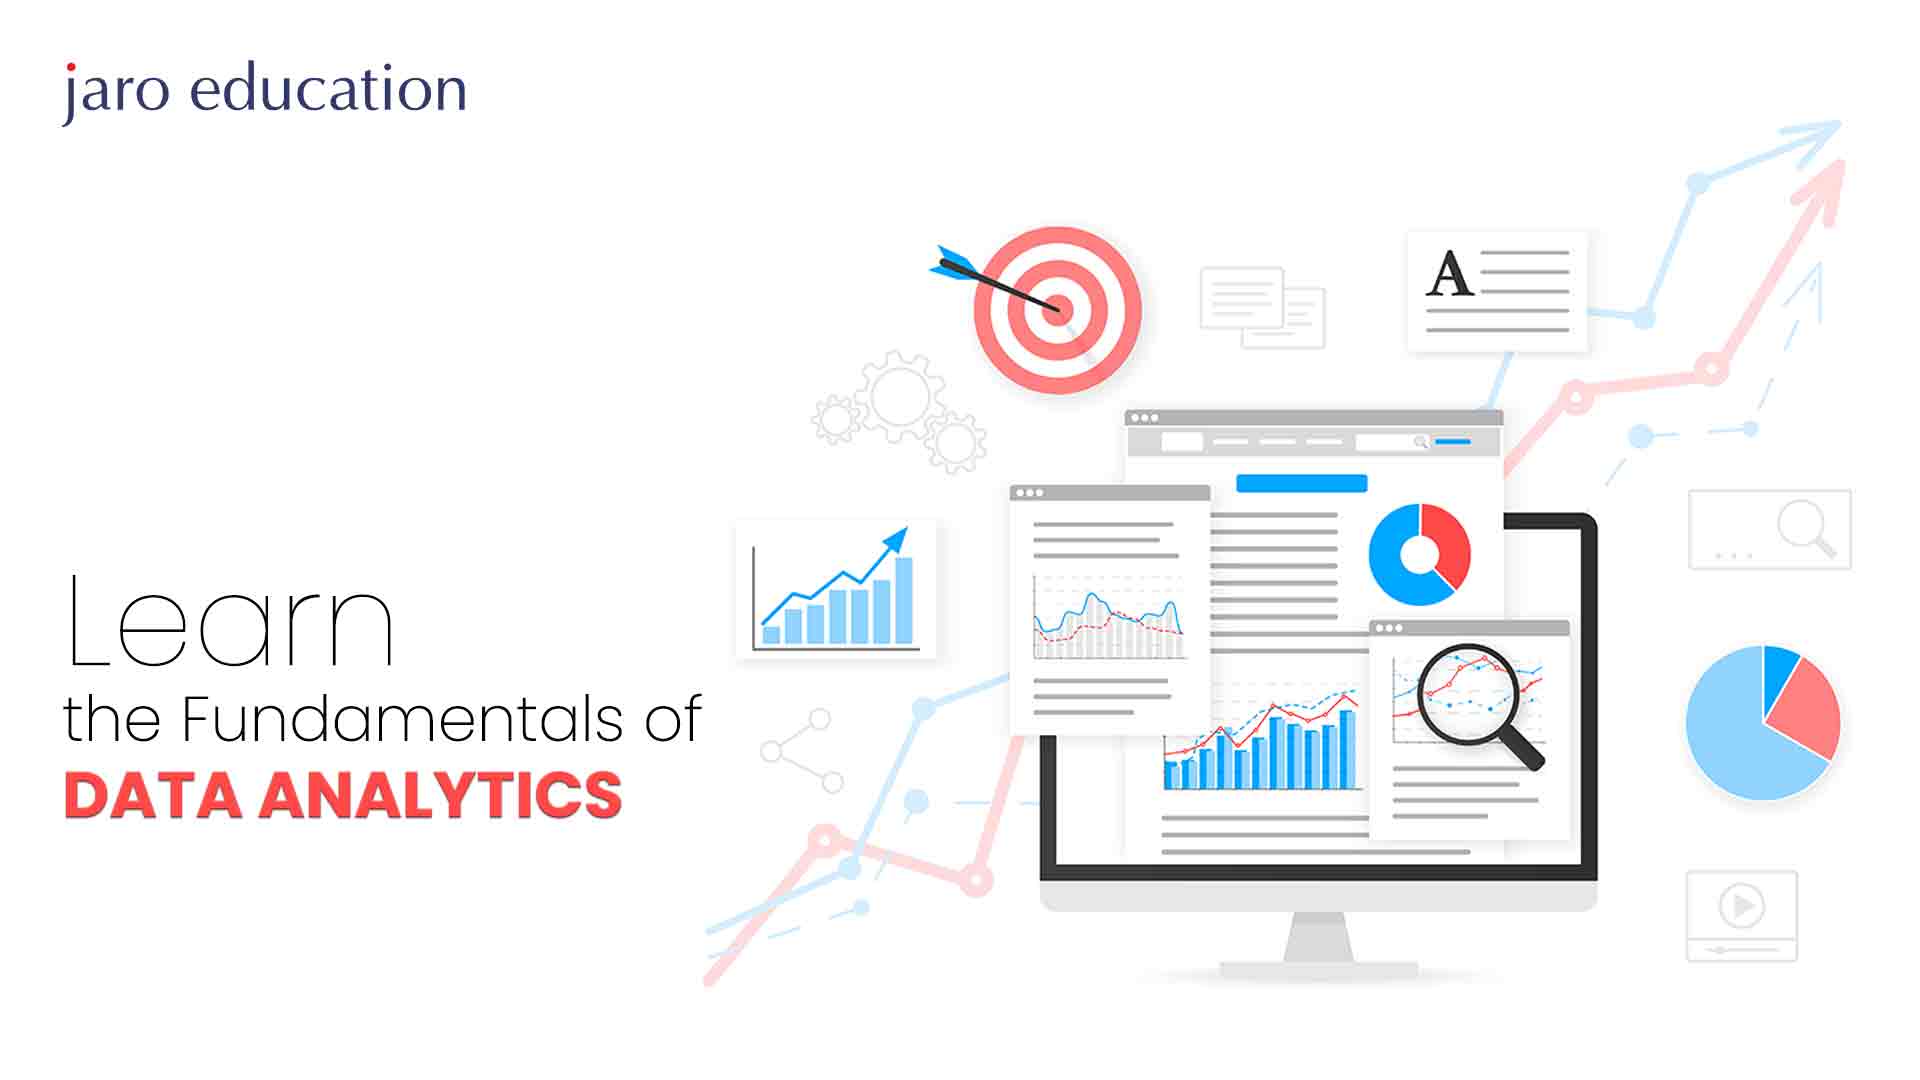
Table Of Content
- What is Data Analytics?
- Importance of Data Analytics
- What are the Different Types of Data Analysis?
- Real World Data Analytics Examples of Amazon
Data analytics is the process of gathering, transforming, and organizing data in order to gain insights, make predictions, and inform decision-making. It’s important to note that data analytics and data analysis, while closely related, have distinct nuances. Data analysis serves as a subset within the broader umbrella of data analytics, focusing specifically on deciphering and interpreting the significance inherent in datasets.
This article delves into key concepts and the significance of data analytics skills. It offers insights into job opportunities and cost-effective specializations, making it a valuable resource for both new and experienced professionals in the fast-paced field of data analytics.
What is Data Analytics?
Companies gather a ton of data all the time. But honestly, raw data by itself doesn’t help at all, and data analytics help sort the data. It’s the process of digging into that raw data to find meaningful and useful insights. These insights become the basis for smart business decisions.
A data analyst is like a detective in this process. They gather raw data, sort it out, and analyze it to turn confusing numbers into clear and understandable information. Once they’ve cracked the code, the data analyst shares their findings through recommendations on what the company should do next.
Think of data analytics as a super-smart tool used to solve specific problems in a business. It’s like finding clues in a dataset that tell you important things about different aspects of the business—like how certain groups of customers behave or how employees use a specific tool.
The magic of data analytics is that it helps you understand what happened in the past and gives you a heads-up on future trends and behaviors. Instead of making guesses, decisions and plans are based on what the data is actually saying. It’s a way to turn raw data into a powerful tool that guides businesses to success in a world where data is king.
For those intrigued by the potential of data analytics and aspiring to master the art of uncovering hidden insights within vast datasets, the Professional Certificate Programme in Advanced Analytics & Business Intelligence at IIM Kozhikode stands as an ideal choice. This meticulously designed course equips individuals with the necessary knowledge and hands-on experience to confidently navigate the complexities of data analytics.
Importance of Data Analytics
Equipped with insights gleaned from data analytics, businesses and organizations attain a profound comprehension of their audience, industry dynamics, and overall corporate landscape. This heightened understanding serves as a cornerstone, empowering them to make strategic decisions and plan effectively for the future.
Data analytics functions as a compass for businesses, illuminating customer behaviors, market trends, and internal operations. Through the identification of patterns and trends within their data, companies can pinpoint areas of strength and areas requiring improvement. This discernment, for example, allows targeted marketing campaigns and refined product development based on a precise understanding of what resonates most with their audience.
On a macro level, data analytics contributes to a holistic evaluation of the company’s overall performance. It aids in assessing the efficacy of various strategies, fostering a culture of continuous refinement and optimization. Whether streamlining internal processes or enhancing customer experiences, businesses can fine-tune their operations with precision, guided by evidence-backed insights.
What are the Different Types of Data Analysis?

*alternative-spaces.com
1. Descriptive Data Analysis
Overview
Descriptive analysis serves as the foundation of data exploration. It involves summarizing and interpreting historical data to provide a comprehensive snapshot of what has occurred in the past.
Techniques
Common techniques include data summarization, aggregation, and visualization. This type of analysis allows organizations to grasp the overall trends, patterns, and characteristics inherent in their datasets.
Example
A retail company analyzes its sales data from the past year, creating visualizations and summary reports to understand which products are the best-sellers, the peak sales periods, and the geographical areas with the highest customer engagement. This descriptive analysis provides a comprehensive overview of the company’s historical sales performance.
2. Diagnostic Data Analysis
Overview
Diagnostic analysis is the detective work of data analysis. It delves into the “why” behind observed patterns identified in descriptive analysis, seeking to uncover the root causes of specific outcomes or trends.
Techniques
Root cause analysis, hypothesis testing, and exploratory data analysis are employed to understand the factors influencing particular events. Diagnostic analysis is crucial for informed decision-making by addressing the underlying reasons for observed data patterns.
Example
Following the descriptive analysis, the retail company notices a sudden dip in sales in a particular region. Diagnostic analysis is employed to investigate further. It reveals that the decline is correlated with a change in marketing strategy in that region. By identifying this root cause, the company can adjust its marketing approach accordingly.
3. Predictive Data Analysis
Overview
Predictive analysis extends beyond historical understanding. It involves using historical data, statistical algorithms, and machine learning techniques to make informed predictions about future trends or outcomes.
Techniques
Regression analysis, time series analysis, and machine learning algorithms are applied to identify patterns and relationships in data. Predictive analysis empowers organizations to anticipate future scenarios and make proactive decisions.
Example
Using historical sales data and customer behavior patterns, the retail company employs predictive analysis to forecast sales for the upcoming holiday season. Machine learning algorithms analyze past trends and customer preferences to predict which products are likely to be popular during the holidays, enabling the company to optimize inventory and marketing strategies.
4. Prescriptive Data Analysis
Overview
Prescriptive analysis is the next step in the data analysis continuum. It not only predicts future outcomes but also recommends actions to optimize or influence those outcomes positively.
Techniques
Optimization algorithms, decision analysis, and simulation modeling are utilized to suggest the best course of action. Prescriptive analysis guides decision-makers by providing actionable insights, helping them navigate the complexities of decision-making to achieve desired goals.
Example
Building on predictive analysis, the retail company uses prescriptive analysis to determine the optimal pricing strategy for the forecasted popular products. The analysis considers factors such as competitor pricing, customer demand elasticity, and profit margins to recommend the most effective pricing strategy. This guides the company in making informed decisions on pricing to maximize revenue.
Real World Data Analytics Examples of Amazon
Amazon, a global e-commerce and technology giant, faced the challenge of optimizing its vast and complex supply chain. With a diverse product catalogue and a commitment to fast and reliable delivery, the company sought to enhance operational efficiency and customer satisfaction.
Objectives
- Optimize inventory management to reduce carrying costs and stockouts.
- Improve order fulfillment processes for faster and more accurate deliveries.
- Enhance demand forecasting accuracy to align inventory with customer demand.
Data Sources
- Sales and order data from the e-commerce platform.
- Supplier data and lead times.
- Transportation and logistics data.
- Customer feedback and returns data.
Descriptive Analysis- Data Analytics Approach
- Analyzed historical sales and order data to identify peak demand periods and popular products.
- Examined logistics data to understand delivery times and transportation efficiency.
Diagnostic Analysis- Data Analytics Approach
- Investigated reasons for delays in order fulfillment or stockouts.
- Analyzed customer feedback and their data to identify patterns and areas for improvement.
Predictive Analysis- Data Analytics Approach
- Implemented machine learning algorithms to forecast demand for different products.
- Used predictive analytics to anticipate peak demand periods and adjust inventory levels accordingly.
Prescriptive Analysis- Data Analytics Approach
- Recommended optimal inventory levels based on predicted demand and supplier lead times.
- Utilized algorithms to optimize order fulfillment processes, reducing delivery times and costs.
Results and Benefits
Efficient Inventory Management
Amazon achieved better alignment between inventory levels and customer demand, reducing carrying costs and stockouts.
Faster Order Fulfillment
Optimized processes and predictive analytics led to faster and more accurate order fulfillment, enhancing the customer experience.
Cost Savings
The data-driven approach to supply chain optimization resulted in cost savings through reduced inventory holding costs and improved operational efficiency.
Enhanced Customer Satisfaction
Customers experienced faster deliveries and a more reliable supply chain, contributing to increased satisfaction and loyalty.
Amazon’s success in optimizing its supply chain through data analytics demonstrates the transformative impact of leveraging data to enhance operational efficiency and customer experience in the e-commerce industry.
After witnessing the impactful role of data analytics in optimizing supply chains, it becomes evident that mastering this skill is crucial for career advancement. For individuals seeking to delve into the intersection of supply chain management and analytics, the “Advanced Supply Chain Management & Role of Analytics” course at IIM Kozhikode is an ideal opportunity.
Those considering elevating their expertise in supply chain management and analytics can position themselves at the forefront of this dynamic field by enrolling in IIM Kozhikode’s course.
Conclusion
In essence, data analytics acts as a compass, guiding individuals through the complex world of data. It is more than just a tool for analysis; it is a multifaceted approach that includes science, engineering, and insightful interpretation. As you begin your journey into the world of data analytics, arm yourself with the necessary skills, investigate various applications, and seize the numerous opportunities that this dynamic field has to offer. The future of data-driven decision-making is just around the corner, and data analytics is the key to unlocking its vast potential.
Find a Program made just for YOU
We'll help you find the right fit for your solution. Let's get you connected with the perfect solution.

Is Your Upskilling Effort worth it?

Are Your Skills Meeting Job Demands?

Experience Lifelong Learning and Connect with Like-minded Professionals

