What is Power BI?: Architecture and Features Explained
Table Of Content
- Significance of Power BI
- Power BI Architecture
- How Does Power BI Architecture Work?
- Key Features of Power BI
Significance of Power BI
Power BI is a collection of software services, apps, and connectors that work together to turn different data sources into unified, interactive, and visually engaging insights. It simplifies how data is connected, discovered, visualized, and shared. Power BI makes it easy to get data from different sources like Excel, databases, Software as a Service (SaaS) applications, etc.
Apart from that, it allows users to quickly build visualizations like reports and dashboards from this data using simple drag-and-drop. These interactive reports and dashboards can then be easily shared across an organization or externally. It also provides a single place to get a unified view of organizational data and make data-driven decisions.
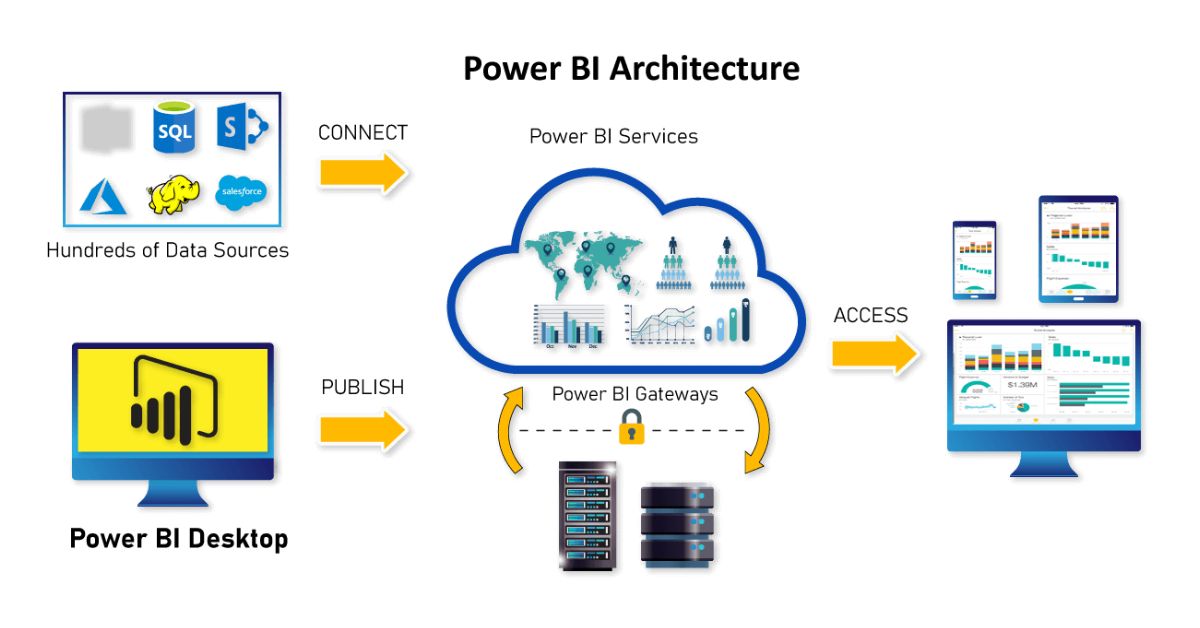
Power BI Architecture
The Power BI architecture consists of several interconnected components working together in a pipeline to deliver business insights. The key components are:
1. Data Sources
One can connect to a wide variety of data sources to ingest data for analysis and reporting. This includes both on-premises and cloud data sources like:
- Excel and CSV files
- SQL Server databases
- Azure data services like Azure SQL Database
- Software as a service (SaaS) applications like Salesforce, Google Analytics, etc.
- Online services like Facebook, GitHub, etc.
With over 100 native connectors, Power BI can connect to data wherever it resides. Both static and real-time data sources are supported.
2. Power BI Desktop
Power BI Desktop is a free, standalone desktop application that enables data transformation, modeling, visualization, and report creation capabilities.
With Power BI Desktop, users can:
- Connect to data sources and import data
- Transform, clean, and restructure data as needed
- Model and analyze data by creating relationships and calculations
- Design interactive reports with various visualizations like charts, maps, widgets, etc.
- Publish reports and datasets to the Power BI Service to share with others
It provides a self-service BI experience through an intuitive drag-and-drop interface without needing IT involvement.
3. Power BI Service
The Power BI Service is a SaaS platform to collaborate, publish, manage, and distribute reports and dashboards. User-created content from Power BI Desktop can be uploaded here. Key capabilities offered by the Power BI Service include:
- Sharing interactive dashboards and reports with others in an organization
- Discussing data through comments and annotations
- Publishing customized datasets and reports to the entire organization
- Automatically refreshing reports with the latest data
- Controlling access and permissions as per security policies
- Monitoring usage metrics and audit logs
- Integrating content into apps and third-party applications
It is the central hub where all end users can access and interact with Power BI content through a web browser or mobile app.
4. Power BI Mobile Apps
To enable the consumption of analytics on the go, Power BI provides native mobile apps for iOS, Android, and Windows. These mobile apps allow easy access to Power BI dashboards and reports from mobile devices. Key features include:
- Dashboards optimized for smaller displays
- Push notifications on data updates
- Offline access using cache
5. Power BI Gateway
This is an optional on-premises data gateway required if the data source is within a private network and needs to be kept completely secure. The gateway acts as a bridge to enable communication between on-premises data sources and the Power BI Service in the cloud. It provides controlled data access without exposing data on the open internet. Microsoft provides two types of gateways:
1. Personal gateway
The personal gateway allows individuals to connect to data sources in their personal on-premises environment for data refresh and DirectQuery. This is installed on the user’s local machine. Key features of personal gateway:
- Refresh schedules for imported data from on-premises sources
- Connectivity to on-premises SQL Server Analysis Services for DirectQuery
- Usage is limited to the individual user
- Suitable for individual contributors and power users
2. Enterprise gateway
Enterprise gateway enables organization-wide connectivity to on-premises data sources and sharing capabilities. It is installed within the corporate firewall. Key features of the enterprise gateway:
- Used by multiple users in an organization
- Scheduling and monitoring capabilities
- Load balancing across multiple gateways
- High availability with automatic failover
- Granular data access control per data source
- Usage and audit logging for compliance
- Works with Power BI, Power Apps, Power Automate, Azure Analysis Services
6. Power BI Embedded
For developers and ISVs, Power BI provides embeddable visuals using JavaScript APIs and Software Development Kits (SDKs). These can be used to embed rich Power BI visualizations within custom web and mobile applications.
How Does Power BI Architecture Work?
Let’s understand how the different components work together in the Power BI architecture:
1. Connect data sources
Power BI Desktop is used to connect to various data sources like CSV files, databases, web services, etc. It supports both on-premises and cloud sources. The data is imported or directly queried.
2. Transform and clean data
The imported data can be transformed, combined and cleaned within Power BI Desktop to prepare it for reporting. Data from multiple sources can be modeled together in this step.
3. Design reports and visuals
Power BI Desktop is used to create interactive reports and visuals based on the data model. These can have charts, tables, slicers and other compelling visuals.
4. Publish to Power BI Service
Users can publish reports, datasets and dashboards from Power BI Desktop to the Power BI Service. This uploads it to the cloud.
5. Share Dashboards and Reports
Uploaded content is now accessible in the Power BI Service for sharing with other users. Sensitive data can be secured.
6. Usage on mobile
Mobile apps on iOS, Android and Windows devices can be used to view and interact with dashboards and reports on the go.
7. Embed into Apps
Developers can embed Power BI visuals into custom applications using Power BI APIs and SDKs.
For on-premises data sources, the on-premises data gateway acts as a bridge to enable communication between the data source and the Power BI Service in the cloud. The gateway provides controlled access without exposing raw data over the public internet.
Key Features of Power BI
Let’s look at some of the key Power BI features:
Interactive Data Visualisations
Easily create compelling charts, graphs, maps and other custom visuals using a simple drag-and-drop interface. Visualizations are interactive with cross-filtering and drill-down capabilities.
Natural Language Queries with Q&A
Type questions about data in plain English and get instant answers in the form of charts and graphs visualized automatically using Q&A.
Hundreds of Data Connectors
Connect to all enterprise data sources. Mainly supports dozens of cloud services and on-premises databases. You can also connect to any data source using custom connectors.
Augmented Analytics
Get AI-driven insights powered by Azure ML automatically highlighting key trends, anomalies, forecasts, drivers and segments in data.
Real-time Dashboards
Stream data from applications, sensors, websites, and more to create real-time dashboards that stay up-to-date with the latest data.
Mobile BI
Interact with dashboards and reports optimized for smaller form factors on iOS, Android and Windows mobile apps. Plus, you can get notifications on critical data.
Embedded BI
With Embedded BI, embed interactive Power BI visuals into custom applications using JavaScript APIs. With that, build custom visuals tailored to your needs.
Analytics Expressions (DAX)
Use DAX, a formula expression language, to add calculated columns, measures and logic in data models. Simple to learn for Excel users.
Row-level Security
Dynamically filter data for each user based on their security credentials, role or context without changing reports with row-level security.
Monitoring and Auditing
Get detailed usage metrics, audit logs and content monitoring capabilities to manage governance and compliance.
Benefits of Using Power BI
Power BI provides significant benefits over traditional BI platforms. Let’s look at the top Power BI advantages:
Self-service analytics
With an easy-to-use interface and unified view of enterprise data, Power BI empowers users without IT involvement. Users can build reports and dashboards themselves without tedious back-and-forth.
Unified view of data
Power BI delivers a unified view of data by connecting to and combining data from multiple sources. It provides a single pane for data across systems and integrates data from cloud services, on-premises databases, Excel, flat files, etc. This presents a holistic view of organizational data in one place.
Interactive dashboards
Create personalized dashboards with advanced drill-down and drill-through explorations and ask natural language questions on data.
Mobile analytics
For mobile analytics, Power BI makes data accessible anywhere, anytime on any device. It optimizes dashboards for smaller displays and enables offline access through caching. This provides easy access to insights on the go.
Real-time analytics
Ingest, report, and analyze real-time data from applications, sensors, social media feeds, and more for instant insights with real-time analytics.
Collaboration
Collaboration is encouraged in Power BI through annotations, discussions, and data storytelling. It enables open conversations and sharing of insights across teams, driving a data culture.
Embedded analytics
Embedded analytics allows the integration of reports and dashboards into applications with Power BI. This expands the reach of insights across the organization and externally to customers, partners, and other users.
Use Cases Where Power BI Delivers Value
<p>Here are some examples of impactful use cases where Power BI has helped drive data-driven outcomes:</p>
<h3>Sales analytics</h3>
<p>Sales teams can analyze customer, product, regional and employee performance data using interactive reports. They can identify new opportunities and optimize processes.</p>
<h3>Marketing analytics</h3>
<p>Marketing teams can connect data from diverse sources like web analytics, CRM, social media, surveys, etc. and measure campaign performance using Power BI.</p>
<h3>Operations analytics</h3>
<p>By using Power BI, analyzing supply chain, logistics, inventory, quality, manufacturing and operational metrics to optimize workflows, reduce costs and monitor SLA compliance becomes easy.</p>
<h3>Financial planning</h3>
<p>Power BI helps consolidate data from multiple ERPs and ledger systems. You can even create driver-based budgets, forecasts and custom reports spanning across departments, business units or geographies.</p>
<h3>Remote monitoring</h3>
<p>You can ingest real-time data from sensors and IoT devices into Power BI to monitor remote assets and detect anomalies as they occur.</p>
<h3>Customer Analytics</h3>
<p>With Power BI, one can create unified customer profiles by connecting data from CRM, support desks, marketing automation systems and more. You can also analyze customer churn, lifetime value and satisfaction.</p>
<h3>Field workforce analytics</h3>
<p>Empower field technicians and agents with analytical insights about assets, inventory, and customer history available at their fingertips. All these are possible with the emergence of Power BI.</p>
<h3>Healthcare analytics</h3>
<p>Healthcare providers can analyze patient records, diagnoses, treatments, clinical trial data, insurance claims and operating metrics like bed occupancy rates for data-driven decisions.</p>
<p>These are just some examples – almost any business use case across departments like Sales, Marketing, Operations, Finance, HR, Supply Chain, etc. can benefit from Power BI capabilities.</p>
Conclusion
Power BI makes it possible to unify data from disparate sources, build interactive reports and dashboards, and share insights across any device. With its seamless end-to-end BI capabilities, Power BI empowers everyone in an organization to make data-driven decisions and act faster.
The Power BI architecture brings together key components like Power BI Desktop, Service, Mobile Apps, and Gateways that enable self-service analytics while maintaining enterprise-grade governance and security.
You can now equip yourself with the knowledge of Power BI and transform your career with IIM Nagpur’s PG Certificate Programme in Data Science for Business Excellence and Innovation. Through this course, learn to derive impactful insights from data through hands-on training in statistics, predictive modeling, machine learning, visualization, and drive data-driven decisions. Developed by renowned IIM faculty, this 6-month online program empowers you with in-demand data science skills. Upskill now and become a business leader of tomorrow.

Find a Program made just for YOU
We'll help you find the right fit for your solution. Let's get you connected with the perfect solution.

Is Your Upskilling Effort worth it?

Are Your Skills Meeting Job Demands?

Experience Lifelong Learning and Connect with Like-minded Professionals

