What Are the Five Methods of Financial Statement Analysis?

Table Of Content
- What is Financial Statement Analysis?
- What Are the Five Methods of Financial Statement Analysis?
- Career Scope in Financial Statement Analysis
- Where to Learn Financial Statement Analysis in Practice
If you look at a company’s financials for the first time, it usually feels straightforward, revenue, profit, and expenses. But the problem is, those numbers don’t always mean what they seem to mean. A business can show profits and still be under pressure financially.
That’s where financial statement analysis actually starts to matter. It’s not about reading numbers. It’s about understanding what those numbers are hiding, or revealing.
So if you’ve been trying to figure out what is financial statement analysis in a way that actually clicks, think of it as connecting the dots between data and reality.
What is Financial Statement Analysis?
At a basic level, financial statement analysis is the process of examining financial reports to understand how a business is really doing. These reports include the income statement, balance sheet, and cash flow statement. Each one shows a different part of the story. But on their own, they don’t tell you much. That’s why analysis is needed.
For example, a company might report higher sales this year. Sounds good. But if its costs have increased even more, profitability may actually be weaker. This is the kind of clarity analysis brings. It helps you avoid taking numbers at face value.
Objectives of Financial Statement Analysis
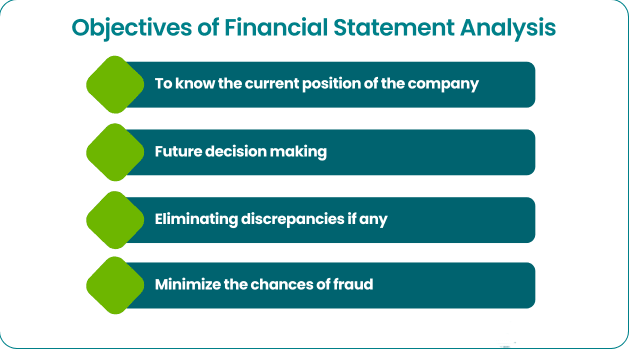
The objectives of financial statement analysis are not as complicated as they sound. In most cases, you’re trying to answer a few practical questions.
- Is the company financially stable?
- Is it improving or getting worse over time?
- How efficiently is it using its money and resources?
- Are there any risks that are not obvious at first glance?
These objectives matter because decisions depend on them. Investors look at them before investing. Banks look at them before lending. Even companies themselves use this analysis to plan ahead.
So it’s not just about understanding the past. It’s also about reducing uncertainty when making future decisions.
Tools of Financial Statement Analysis
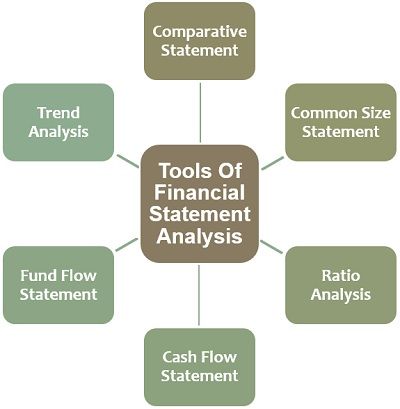
To make the analysis easier, different tools of financial statement analysis are used. These tools don’t replace thinking, they just help structure it better.
Some common ones are:
- Ratio analysis
- Common-size statements
- Comparative statements
- Trend analysis
- Cash flow analysis
Each tool has its own purpose. For example, ratios simplify complex data into a few key numbers. Common size statements help you compare proportions instead of raw values.
In real situations, analysts don’t stick to just one tool. They combine multiple approaches depending on what they’re trying to understand. That’s usually where better insights come from.
What Are the Five Methods of Financial Statement Analysis?
Once the basics are clear, the next step is understanding the methods of financial statement analysis. These are not complicated formulas, they’re just different ways of looking at the same data. Each method highlights something different.
Let’s go through them one by one:
1. Horizontal Analysis
Horizontal analysis is about comparison over time. You take financial data from different years and see how it has changed. For example, if revenue grows every year, that suggests consistency. But if expenses are growing faster than revenue, that’s something you can’t ignore.
This method helps you spot trends and also sudden changes. And usually, it’s those sudden changes that tell you the most. If something doesn’t look normal, there’s usually a reason behind it. That’s why horizontal analysis is useful, it gives you direction, not just numbers.
2. Vertical Analysis
Vertical analysis looks at a single financial statement and breaks it down into proportions. For instance, you might calculate what percentage of revenue is going into expenses. This makes it easier to understand the company’s cost structure.
One advantage here is comparison. Even if two companies are very different in size, you can still compare them using percentages. It also helps you see whether spending patterns make sense. Sometimes, the issue isn’t how much a company earns, it’s how it spends.
3. Ratio Analysis
Ratio analysis is one of the most commonly used methods of financial statement analysis, mainly because it simplifies things. Instead of going through pages of data, you focus on key ratios like:
- Liquidity ratios
- Profitability ratios
- Efficiency ratios
- Leverage ratios
Each ratio highlights a specific aspect of the business. For example, liquidity ratios tell you whether a company can handle short-term obligations. Profitability ratios show how much profit is actually being generated. But ratios need interpretation. A number on its own doesn’t mean much unless you understand the context.
4. Trend Analysis
Trend analysis looks at performance over a longer period. Instead of focusing on year-to-year changes, it looks at patterns. You usually take a base year and compare everything to it. This helps in identifying whether the business is moving in a stable direction.
If performance is improving consistently, that’s a good sign. If it keeps fluctuating, it may indicate instability. This method is especially useful when you’re thinking long-term. Because one good year doesn’t mean much, but a consistent trend usually does.
5. Cash Flow Analysis
Cash flow analysis focuses on actual cash movement. And this is where things get real. A company might show profits but still face problems if it doesn’t have enough cash. That’s why this method is important.
It looks at:
- Operating activities
- Investing activities
- Financing activities
This helps you understand whether the business can sustain itself. In many cases, cash flow tells a very different story compared to profit.
Career Scope in Financial Statement Analysis
If you’re thinking about where financial statement analysis can actually take you, the answer is, much further than it seems at first. This isn’t a niche skill. It sits at the center of how businesses make decisions.
At the entry level, it naturally leads to roles like financial analyst, business analyst, or junior accountant, where your main job is to understand and interpret financial data. But as you gain experience, the scope expands into more strategic roles such as investment banking, equity research, corporate finance, and consulting.
What really makes a difference, though, is not your ability to calculate, it’s your ability to interpret. Most people can work out ratios. Fewer can explain why a company’s performance is changing or what it means going forward. That’s the gap companies are actively looking to fill.
And this is why the skill stays relevant even outside finance. Whether you move into management, strategy, or even start something of your own, understanding financial performance becomes a constant requirement.
In today’s environment, especially with businesses becoming more data-driven, the demand for professionals who can make sense of numbers is only increasing.
So the career scope here isn’t limited to one role or industry. Once you get comfortable with financial statement analysis, you’re building a skill that grows with your career, rather than restricting it.


Where to Learn Financial Statement Analysis in Practice
At some point, just reading about financial statement analysis stops being enough. You understand the definitions, you’ve seen the methods but when you sit down with an actual company’s financials, it still feels a bit unclear.
At Jaro Education, we focus on closing that exact gap with our courses from top B schools. If you’re looking to go deeper, the Online MBA FinTech – Amrita Vishwa Vidyapeetham is designed for that next step. Here, financial statement analysis isn’t taught in isolation. It’s connected with fintech, risk assessment, and strategic decision-making, so you’re not just learning concepts, you’re learning how to use them.
And if you’re just starting out, we also offer the Finance for All – Free Finance Certification Course. It’s a simple, structured way to build your foundation without overcomplicating things. You get clarity on the basics, which makes everything else easier to grasp later.
Conclusion
In simple terms, financial statement analysis helps you understand what’s actually going on behind the numbers. Once you get used to it, you stop just reading financial statements, you start questioning them, which eventually helps you make better decisions. And over time, this skill can turn into a strong career advantage.
Frequently Asked Questions
The main objectives are to assess financial health, track performance, support decisions, and identify risks early.
The five methods include horizontal analysis, vertical analysis, ratio analysis, trend analysis, and cash flow analysis.

Related Courses
Explore our programs


Find a Program made just for YOU
We'll help you find the right fit for your solution. Let's get you connected with the perfect solution.

Is Your Upskilling Effort worth it?

Are Your Skills Meeting Job Demands?

Experience Lifelong Learning and Connect with Like-minded Professionals

