- jaro education
- 20, January 2024
- 9:00 am
Finance is increasingly powered by real-time data. As information flows at lightning speed, there is a growing need for analysts who can digest high-velocity data streams and generate insights instantly. This is catalyzing a shift towards real-time finance – where trading, risk management, and reporting happen in milliseconds rather than days.
For finance students, real-time finance projects enable hands-on learning across a range of in-demand skills – from programming smart contracts to visualizing streaming market data. This equips them with the real-time capabilities that modern financial institutions demand. Disciplines like algorithmic and high-frequency trading would not even exist without the ability to analyze and act on real-time data.
By undertaking projects that interface with live data feeds, students get real-world experience in emerging domains at the intersection of finance and technology. The top real-time finance-related project topics highlighted in this blog allow students to stand out with relevant, cutting-edge capabilities.

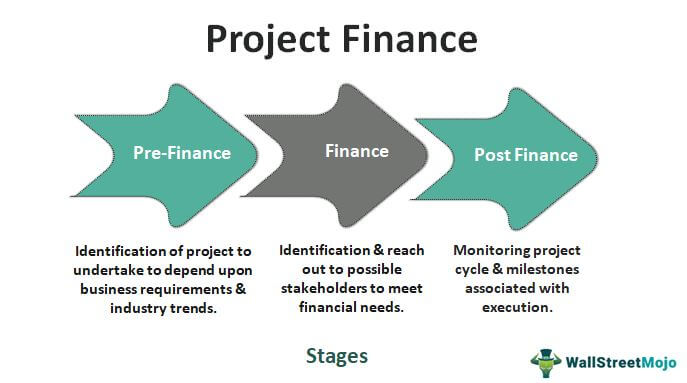
*www.wallstreetmojo.com
Table of Contents
Top 10 Real-Time Finance Project Ideas You Should Watch Out
Here is a list of the top 10 real-time finance project topics for students:
1. Real-time Stock Market Analyzer
A stock market analyzer that processes live stock data lets students build a tool just like professional traders use every day. Market data APIs give access to a continuous flow of prices, volumes, and news, as close to real-time as technically possible. This is way more engaging than historical or bundled datasets.
The first step would be to connect to established market data services such as IEX Cloud, Polygon, or Yahoo Finance, ingest the streams, and store the raw data. You can build interesting visualizations once the piping is set up – interactive charts tracking live prices, trading volumes, volatility, moving averages, or all market news events like earnings reports. Widgets to view real-time indexes, stock dashboards, and global market heat maps are also great additions.
By structuring this real-time data, students can calculate on-the-fly metrics like MACD, Bollinger Bands, or RSI using code libraries like TA-Lib. These are key trading indicators professionals use daily to identify opportunities. Having the foundations of the data pipelines and visualizations in place enables more advanced analysis. The next level is developing automated trading signals that trigger when particular technical analysis conditions are met. TradingView offers useful charting libraries to visualize these technical analysis metrics and signals as they update in real-time.
2. Automated Trading Bot
An automated trading bot finance project teaches core algorithmic trading principles while giving students hands-on practice in strategy building and backtesting. By integrating with paper trading platforms, students can simulate live automated trades to really bring concepts to life.
Paper trading uses real market data and emulates order execution, fills, fees, slippage, and margin without actual capital at risk. Popular platforms like TradeStation, MetaTrader, and QuantConnect offer robust development environments for trading bots, along with paper accounts for live-simulation trading.
Students begin with this project by formulating rule-based trading ideas that can be coded into automated strategies – quantitative rules dictating market entry and exit points. These rules could include trend-following signals, mean reversion triggers, volume analysis, or even advanced algorithmic models powered by AI.
The next step is quantifying strategy behavior over historical data to gauge hypothetical performance via crucial portfolio metrics like risk-adjusted return, win rate, Sharpe ratio, and drawdowns. Once a strategy is refined, optimization techniques like tweaking inputs and adjusting stop losses and profit targets can be applied to tune the algorithm’s performance.
3. Sentiment Analyzer for Financial News
News moves markets, but determining market-moving signals from the endless flood of reporting is easier said than done. This project applies natural language processing (NLP) to tap into news and social media streams to gauge sentiment – and predict price reactions.
The first technical challenge is aggregating streams of textual content from newswires, financial publications like Twitter feeds, and aggregators like Benzinga. This requires web scraping and API mastery. For efficiency, students can tap into curated datasets, but real-time data streams would reflect the cutting edge.
Once content streams are set up, the natural language processing layer does the heavy lifting. Applying sentiment analysis techniques like VADER against incoming articles identifies whether the prevailing emotion is positive, negative or neutral about a company or stock. Adapting lexicons specific to finance projects sharpens accuracy levels even further.
With historical news content, students can backtest whether market-moving signals can be derived – does an overwhelmingly positive or negative news sentiment foreshadow impending stock price changes? Building this predictive capability with real-time news lets students test their models live.
4. Blockchain Data Analytics
Blockchain platforms like Ethereum and Solana produce vast troves of real-time data as decentralized applications are used for trading tokens, lending and borrowing, earning yields, and more. These finance-related projects dive into analyzing metrics across high-value DeFi protocols to uncover trading signals or develop pricing models.
Students gain access to live on-chain data from blockchain networks either by spinning up an indexing node using tools like The Graph or Dune Analytics or via provider APIs like Chainstack and Moralis. This surfaces data streams reflecting transaction volumes, contract calls, token prices, protocol revenue and other high-fidelity blockchain activity.
With real-time data pipelines established, students can build interactive dashboards to track activity spanning popular DeFi applications like decentralized exchanges (DEXs), lending markets, yield optimizers, and more. Visualizing critical metrics like total value locked, protocol revenue run-rates, token velocities, and pricing models reveals data-driven insights. Correlating on-chain data with price movements helps gauge protocol utilization and efficiency. From observing spike volumes in DEX activity to fluctuating collateral ratios across lending pools, students can get a first-hand view of capital flowing between DeFi Lego primitives in real-time.
5. High-Frequency Trading Simulator
High-frequency trading relies on unparalleled connectivity and systems to execute trades quickly ahead of market changes. This project lets students simulate a high-frequency trading system, wherein they can use paper trading platforms made specifically for high-speed trades.
Students can test placing large numbers of stock, derivative, and currency orders in milliseconds on these platforms. The platforms accurately imitate real exchange systems. This covers connecting to markets, getting live order book data, carefully routing orders, changing them, canceling them very quickly, and measuring performance.
The main benefit is the ability to adjust things like trade speed, order sizes, and latency limits to improve strategies. Just like real markets, the simulator shows fill rates, rejection rates, and estimated gains from high speeds. This realistically shows key metrics important for profitable high-frequency trading.
6. Real-Time Financial Visualizations
Visualizing real-time data transforms raw metrics into dynamic insights. This finance project focuses on building financial dashboards that allow students to showcase and interact with live data feeds spanning markets, portfolios, risk models, and more. By tapping into finance APIs in domains like trading, alternative data, DeFi platforms, news analytics, and more, students gain access to an abundance of real-time data streams. Structuring these feeds then allows customized dashboards to be built that equip users to track and analyze key metrics on demand.
For example, students could build mobile-friendly dashboards plotting real-time stock technical indicators with visual analytics libraries like Dash or Plotly. Interactive features like generating signals, modifying indicators’ parameters, and overlaying related data amplify utility.
At an advanced level, developing holistic portals with market heat maps, custom indices tracking baskets of assets, intelligent alerts, and personalized recommendations powered by live data takes the concept further.
7.Quantitative Analyst Workspace
This project creates an integrated workspace that brings together diverse real-time data streams critical for quantitative research and modeling. Setting up an expandable platform requires connecting to a range of common data feeds quantitative analysts rely on — exchange market data, alternative datasets spanning sectors or geographies, news analytics, social sentiment APIs, and blockchain data. Students can tap into providers like Tiingo, Intrinio, Polygon, Alpha Vantage, FinnHub, and NewsAPI, for that matter.
Ingesting and structuring these real-time feeds then allows building analysis tools and models on top of the aggregated data foundation. This includes developing notebooks, backtesting frameworks, and modeling libraries for techniques like time-series forecasting, simulation, statistical arbitrage, pairs trading, etc.
Thus, the ultimate goal is an end-to-end environment where students can ideate, prototype, test, and refine quantitative strategies via access to rich real-time data sources, modeling tools, and programmatic trading capabilities.
8. Algorithmic Trading with Reinforcement Learning
Reinforcement learning (RL) trains algorithms to make optimal decisions via ongoing trial-and-error interactions with dynamic environments. This cutting-edge machine-learning technique can unlock smarter automated trading strategies. In this finance project, students develop trading agents that place paper trades while aiming to maximize a reward function based on trading returns adjusted for risk metrics. Initial randomized trades and strategy experimentation drive the RL agent to reinforce actions that tend to generate rewards over time.
Libraries like TensorFlow Quant provide pre-built RL algorithms for trading – reducing the advanced math behind techniques like proximal policy optimization or deep Q-learning. Students focus more on structuring trade simulation environments, defining reward functions, representing market state spaces, and analyzing training episodes. Backtesting over historical data provides the offline reinforcement learning training ground before evaluating strategies live. Plotting cumulative returns over training iterations illustrates the agent honing decision-making and hitting key milestones. This can really bring state-of-the-art machine-learning techniques to life!
Once satisfactory strategy optimization levels are reached, the trained agents can execute trades via paper trading platforms as the final test of live performance. This could even compete against student-coded rules-based strategies!
9. Smart Contract and DeFi Prototyping
By coding decentralized finance (DeFi) style smart contracts that enable trustless token trading, lending, and portfolio management – students grasp blockchain programming while unlocking new fintech possibilities.
Platforms like Remix and Hardhat provide sandbox-like developer environments for writing Solidity smart contracts and testing functionality. Students can build contracts for core DeFi building blocks like fungible tokens, non-fungible tokens lending pools, and decentralized exchanges, enabling automated token swaps and liquidity pools with automated market making.
With contracts deployed on test blockchains, user interfaces can be built to interact with the developed protocols. Seeing the financial use cases come to life via these UIs adds valuable context. Students can even experiment with “plugging in” their own contracts into other DeFi protocols to grasp composability.
Analysis dashboards add the final layer to track adoption and user interactions spanning the deployed DeFi protocols. This could cover metrics like token supply distribution, staked collateral ratios, exchange volumes, and fees collected.
10. Robo-Advisor for Stock Portfolio Management
Robo-advisors automate portfolio management by allocating assets and rebalancing based on algorithms. This project let students build and test their own robo-advisor models.
The first step is defining the robo-advisor methodology for constructing optimized portfolios across a universe of equities and ETFs. This covers the structured framework linking user risk profiles to strategic asset allocations and weighting schemes.
Connecting to paper trading platforms like QuantConnect then allows backtesting portfolios over historical market data while iterating on allocation models and benchmarking performance metrics like volatility, returns, Sharpe ratio, drawdowns, and risk-adjusted returns.
Once satisfactory backtest output is achieved, students can shift to paper trading their strategies live. This means simulating placing trades programmatically based on their coded robo-advisor logic as it dynamically adjusts positions to match shifting target allocations. Tracking slippage, market impact, and transaction costs make a robust evaluation.
Adding a user-interface layer for specifying client risk levels and viewing recommended portfolio constructions, performance dashboards, and reporting functionality takes the project closer to a real-world robo-advisor application.
Conclusion
The finance industry is driven by data – analyzing faster streams to trade smarter. These real-time focused MBA finance project topics deliver an invaluable head-start by directly exposing the hands-on development workflows for addressing real problems institutions face.
Core technologies like cloud infrastructure, algorithms, data visualization, and APIs underpin most applications demonstrated across automated trading systems, research platforms, wealth management portals, and risk models. Finance project milestones provide structured paths to hone specific skill sets like data engineering, quantitative modeling, or full-stack development.
To understand various financial projects discussed in this blog, advance your finance career by acquiring the most in-demand blend of skills with Executive Certificate Program in Corporate & Strategic Finance, by IIM Mumbai. Develop cutting-edge analytical aptitude and strategic decision-making abilities through this 9-month intensive program. Learn how to conduct advanced financial modeling, optimize capital structure, evaluate strategic M&A opportunities, manage investment portfolios, etc. With acclaimed IIM Mumbai faculty and peer-learning pedagogy, this program delivers a transformative learning experience, empowering finance professionals for the roles of tomorrow. Apply now and unlock your true potential!


