

- jaro education
- 23, May 2024
- 6:10 pm
Introduction
In today’s world of digitalisation, data is considered one of the most important assets of businesses. Analysing this data can help optimise performance by identifying efficient ways of doing business. Factor analysis (FA) and principal component analysis (PCA) are among the effective analytical techniques that help reduce data complexity. Notably, FA focuses on uncovering latent factors that establish correlations among variables. And, PCA aims at not only maximising variance but also identifying principal components. Read ahead to explore more about these analytical techniques.
What is Factor Analysis?
*theanalysisfactor.com
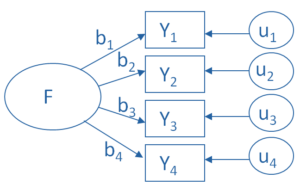
Factor analysis works by assuming that a set of observed variables is influenced by a smaller number of unobserved variables (also known as factors). It is to be noted that these factors are nothing but latent constructs reflecting data’s underlying dimensions. And, they are determined by maximising the correlation between observed variables (linear combinations of factors and some error terms) and factor scores.
Table of Contents
According to the factor analysis model, variables are determined by common factors (estimated by the model) and unique factors (which do not overlap between observed variables). Also, the estimates rely on the assumption that all unique factors are uncorrelated with each other, as well as common factors.
Often used in social science research, factor analysis has two types, including:
- Confirmatory Factor Analysis (CFA): A researcher uses this technique when he/she wants to test a hypothesis in order to confirm or reject the preconceived structure.
- Exploratory Factor Analysis (EFA): It is applied when the underlying structure of variables is unknown, especially while developing a measurement model for a specific theory. Without imposing a preconceived structure on the output, it helps find out the possible underlying factor structure.
Often used in data reduction, factor analysis helps in identifying a small number of factors that cause most of the variance in a larger number of manifest variables. Offering a high degree of flexibility, the technique can also be applied to generate hypotheses related to causal mechanisms.
Let’s understand this with the help of an example. If you want to understand what underlying attitudes drive people to take up a political survey, then it is important to examine the correlations amongst various survey items. You will observe that there is significant overlap. Applying factor analysis can help you investigate the number of underlying factors. Not only this, but it lets you compute factor scores for every respondent. And, this can be used in subsequent analyses.
Data Considerations for Factor Analysis
- Variables need to be quantitative at the ratio or interval level.
- Categorical data talking about the country of origin or religion are not considered suitable.
- Data is considered suitable for factor analysis if Pearson correlation coefficients can be calculated for the same.
- There needs to be a bivariate normal distribution for every pair of variables.
- Also, observations need to be independent.
Besides, you can read about the impact of simple data analysis techniques here.
What is Principal Component Analysis?
Principal component analysis works by transforming a set of correlated variables into a set of uncorrelated variables (also known as principal components or PCs). Representing linear combinations of original variables, these PCs can help represent data in a lower-dimensional space or represent the direction with the highest variance. It is to be noted that the first principal component records the maximum amount of variance. The second principal component captures the maximum amount of variance that is orthogonal to the first one. And, this process continues.
Known for eliminating redundant data by removing features offering duplicate information, principal component analysis creates new dimensions or components that are independent of each other. Works by reducing unnecessary complexity in the data, PCA evaluates the adequacy of dimensionality reduction. It does so by evaluating the cumulative proportion of variance explained by the retained PCs. Notably, PCA reduces the number of dimensions in large datasets to PCs by transforming correlated variables into a smaller set of variables.
Developed by Karl Pearson in 1901, principal component analysis effectively visualises and explores high-dimensional datasets. It can identify patterns, trends or outliers without any hassle.
In most cases, principal component analysis is used for data preprocessing for machine learning (ML) algorithms. While preserving the relevant information from the original dataset, the technique can extract the most informative features from large datasets, reducing model complexity.
Additionally, principal component analysis reduces or removes common issues of multicollinearity (when two or more independent variables are correlated) and overfitting (generalise poorly to new data) by projecting a high-dimensional dataset into a smaller feature space. Commonly applied in regression analysis, PCA can also be used for pattern recognition, image processing, and signal processing.
Notably, principal component regression and kernel principal component analysis are other variations of PCA.
How Does Principal Component Analysis Work?
Principal component analysis summarises large datasets into a smaller set of uncorrelated variables or PCs that are known to have the maximum variance. Also, principal components record the maximum amount of information from the original dataset.Using linear algebra and matrix operations, PCA transforms the original dataset into a new coordinate system comprising principal components. Notably, eigenvectors and eigenvalues from the covariance matrix help in analysing linear transformations.
How Principal Components are Calculated?
The PCA computation process includes the following steps:-
- Standardise initial variables
- Calculate the covariance matrix to identify correlations
- Compute the eigenvectors and eigenvalues
- Choose principal components
- Transform data into the new coordinate system
Difference between Principal Component Analysis and Factor Analysis
One of the major differences that separate principal component analysis from factor analysis is their purpose. While PCA is applied for data compression and visualisation, FA is known for hypothesis testing and data interpretation. Also, PCA does not involve assumptions related to causal relationships between variables, but FA assumes the factors leading to observed variables. In addition, PCA does not account for measurement errors, but FA does.
Further, the two analytical techniques have different criteria for choosing the number of components or factors. On one hand, principal component analysis uses eigenvalues or the proportion of variance explained, on the other hand, factor analysis uses factor loadings or communalities.
It is to be noted that principal component analysis needs scaling and standardisation of data before analysis begins. If standardisation is not performed, then variables with larger scales dominate over the ones with smaller scales. Contrary to this, FA technique can be used without standardising data as it lays emphasis on the correlation matrix, and not the covariance matrix.
To understand this, let’s try to analyse aircraft fuel efficiency data. To use PCA, it is important to standardise variables, such as speed, weight, and fuel consumption, so that no attribute influences the outcomes owing to scale differences.
Principal component analysis needs less stringent assumptions when it comes to data, whereas factor analysis may demand certain assumptions like normality and linearity in order to accurately estimate factor loadings.
For example, PCA doesn’t require extensive data preprocessing to offer valuable insights into patterns of environmental variables impacting air quality. On the other hand, it is vital to ensure that the survey data of a psychometric study meets FA assumptions for reliable factor extraction.
Moreover, factor analysis reveals latent factors that store variable information. Unlike principal component analysis, this technique transforms numerous attributes into smaller factors to identify shared themes. Features having similar meanings form factors. And, this represents elements correlated with multiple variables. Though these latent constructs (such as market risk and socioeconomic status) are not measurable directly, they collectively affect variables. For example: an individual’s health is affected by socioeconomic factors, including employment, education, and income, collectively. FA helps bring to the fore such hidden relationships.
In order to determine the directions of maximum variance, principal component analysis computes eigenvectors (which represent PCs) and eigenvalues (talk about the amount of variance) of the covariance matrix of the original variables. On the other hand, factor analysis estimates communalities and factor loadings using the correlations or covariances amongst observed variables. This aims to identify factors that account for the shared variance amongst variables.
A reflection of original variables, PCA uses linear combinations to represent original variables. And, FA establishes a relationship between observed variables and a smaller set of unobservable factors. Besides, principal component analysis is sensitive to the scale of the variables owing to which it calls for the standardisation of data. Whereas in factor analysis, standardisation is often recommended, but the emphasis is laid on the correlation matrix instead of variance.
| Aspect | Principal Component Analysis | Factor Analysis |
|---|---|---|
| Objective | Maximises variance | Identifies latent factors |
| Assumptions | No latent structure assumed | Assumes latent factors |
| Interpretation | Directions maximising variance | Underlying influences on variables |
| Usage | Feature reduction, visualisation | Identifying latent constructs |
Applications of Factor Analysis
Factor analysis has many applications in the fields of psychology, biology, economics, and engineering. The technique can be used to gauge personality traits, attitudes, intelligence, or preferences. Also, FA models can be applied to identify latent factors that affect economic growth, social indicators or consumer behaviour.
For many, FA is the go-to approach for analysing survey results, including customer interviews. It is to be noted that such surveys must have closed questions that must reflect what you want to measure. Also, it is vital to ensure that the same answer scale (numeric or alphabetic) is adopted for all the questions.
Applications of Principal Component Analysis
Principal component analysis is popularly used in different fields like engineering, economics, biology, and psychology. PCA can easily analyse facial images or recognise faces. Also, the technique can be used to reduce noise and improve signals in spectroscopy data.
Many people rely on PCA for feature reduction while dealing with a sizable array of features in ML. Using this technique can preprocess (or extract) the most informative features from datasets having many variables. Notably, complexity is reduced during preprocessing.
Some scenarios where principal component analysis is commonly used include:
Image compression: The technique reduces image dimensionality while preserving relevant information. This helps create easy-to-store-and-transmit compact representations of images.
Data visualisation: Principal component analysis visualises high-dimensional data as it projects it into a lower-dimensional space like 2D or 3D. This not only simplifies data interpretation, but also its exploration.
Noise filtering: Focused on principal components that capture patterns, PCA helps remove redundant information.
Healthcare: The technique has also been adopted in the healthcare sector. For instance, PCA has assisted in early and accurate diagnosis. Also, a study utilised data from patients at the University of Wisconsin Hospitals, Madison, to predict breast cancer using principal component analysis with logistic regression.
How to Choose Between Principal Component Analysis and Factor Analysis?
Principal component analysis and factor analysis are nothing short of two data detectives who are involved in solving different cases. On one hand, PCA aims at finding the biggest trends or variance in the data. The easiest example to understand this is grouping the largest items to organise a messy room. With no hidden suspects or latent factors, the technique lays emphasis on reducing data and visualising patterns.
On the other hand, factor analysis needs underlying themes or factors that influence multiple variables. For example, using fancy cookware, expensive plates, or cookbooks, to uncover the foodie theme. With hidden suspects, this technique must be considered for understanding relationships and building models.
It is to be noted that you can go with PCA for data cleanup exercises and finding trends. And, FA can be selected to identify hidden connections and offer deeper insights.
Whether to choose PCA or go with FA, this depends on the research question, analytical objectives and data characteristics. In general, PCA is best suited for exploratory analysis, visualisation, and data compression. And, FA must be employed for data interpretation, confirmatory analysis, and hypothesis testing.
Since FA attempts to model unique variance, the technique should be preferred over PCA when distinguishing between shared variance (common factors) and specific variance (unique factors).
While there is no one rule to decide which technique to use, at times both PCA and FA can be employed interchangeably or complementarily. What is important here is to understand the limitations, assumptions, and implications of both the techniques.
Conclusion
By and large, both factor analysis and principal component analysis are used to simplify complex data. While we have already discussed differences, there are many similarities too. These dimensionality reduction techniques help in reducing clutter by condensing variables into fewer dimensions and making data easier to visualise. Also, FA and PCA can help reveal hidden patterns in order to understand the underlying structure. Not just this, both techniques use linear transformations. Last but not least, neither FA nor PCA needs labelled data, which makes them useful for exploratory data analysis.
If you want to explore the world of deep data analytics to help businesses make informed decisions, then enrol in Post Graduate Certification Programme in Business Analytics & Applications – IIM Tiruchirappalli. This course will not only help you acquire data interpretation skills, but also equip you with the essential knowledge to predict future patterns. You can reach out to Jaro Education to enquire further.
FAQs
1. How do principal component analysis and factor analysis simplify complex data?
Factor analysis and principal component analysis specialise in simplifying complex data by reducing dimensionality and retaining crucial information. They not only uncover underlying patterns and structures, but also offer valuable insights and improve analysis efficiency. These techniques aid in visualisation, feature extraction, and noise reduction. Also, they are widely used in biology, machine learning and psychology. Not just this, they are popularly used in market research for consumer behaviour analysis and segmentation. In addition, FA and PCA are employed in pattern recognition tasks, including facial and speech recognition.
2. What are the similarities between principal component analysis and factor analysis?
Principal component analysis and factor analysis have many similarities. Both techniques use matrix decomposition methods to obtain components or factors. Based on the correlation matrix of the data, these techniques can easily take up data reduction and feature extraction tasks. Besides, both PCA and FA can be applied to different kinds of data like binary, continuous, ordinal, or mixed.
3. How are principal component analysis and factor analysis used to minimise the dimensionality of data?
Principal component analysis and factor analysis are designed to minimise the dimensionality of data while retaining maximum important information. Both the techniques achieve this task by transforming original variables into a smaller set of components.
4. How do principal component analysis and factor analysis extract factors or components?
PCA and FA use original variables’ covariance or correlation matrix to extract factors or components.
5. What are the applications of principal component analysis and factor analysis?
Principal component analysis and factor analysis can be used to accomplish tasks, such as feature extraction, exploratory data analysis and data compression. Additionally, both PCA and FA are applied in the fields of finance, psychology, biology, and engineering.
6. What are the other dimensionality reduction techniques available?
Besides PCA and FA, other dimensionality reduction techniques include linear discriminant analysis, uniform manifold approximation and projection (UMAP), random forest, and t-distributed stochastic neighbour (t-SNE).
7. When to use principal component analysis?
Factors like computation, linearity, information preservation and feature extraction must be considered in order to select PCA for analysis.
8. What is the duration of the Post Graduate Certification Programme in Business Analytics & Applications – IIM Tiruchirappalli?
The duration of the Post Graduate Certification Programme in Business Analytics & Applications – IIM Tiruchirappalli is 1 year.
9. What are the objectives of the Post Graduate Certification Programme in Business Analytics & Applications – IIM Tiruchirappalli?
The course will help participants to analyse and represent data in a useful and easy-to-understand manner. Participants will learn the art of reading and interpreting analytical reports. They will be able to perform analytics and draw insights for better decision-making. In addition, participants will learn to develop dashboards and user-friendly analytical tools.
Trending Blogs