Data Analytics Course Syllabus: Fees, Duration, Eligibility (2025 Updated)

Table of Contents

Data-Analytics-Course-Syllabus-Fees,-Duration,-Eligibility-(2025-Updated)

In today’s fast-paced and data-driven environment, every business requires genuine data for their business growth. With the help of data analytics, enterprises acquire genuine and credible information that helps them make quick and knowledgeable decisions. 

Now, to ensure that correct data is available, companies are focusing more on hiring data analysts. As the role of a data analyst is a highly demanding job in the market, aspirants should have a comprehensive understanding of this domain to land the right job. To do so, they need to complete a data analytics course.

To help their cause, this write-up provides general guidance on data analytics course fees, course structure, eligibility, duration, etc. So, read on to learn more.

Data analytics process

*airbyte.com

What Is Data Analytics​?

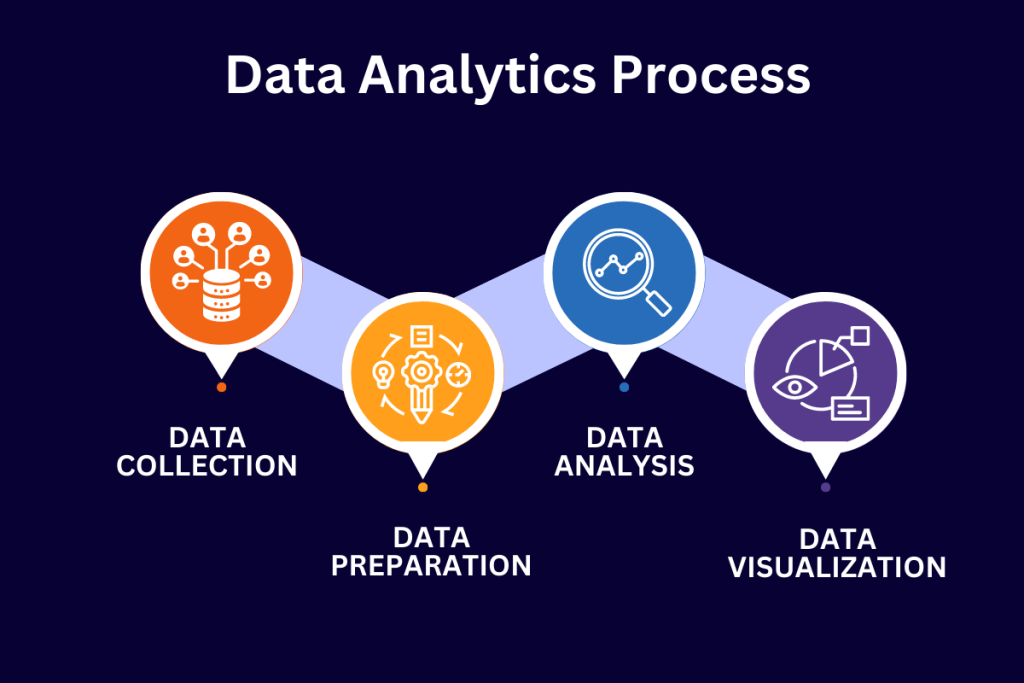
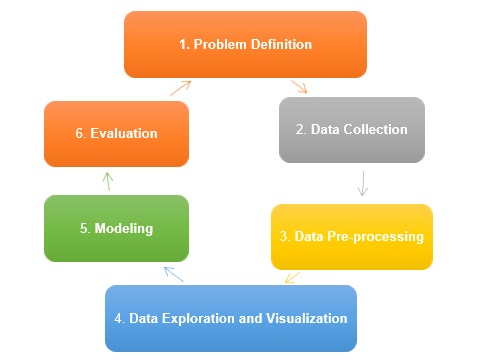
In simple terms, data analytics is a multidisciplinary field that converts raw data into usable insights. So, it includes numerous tools and techniques of mathematics, computer science, and statistics. With the help of tools and techniques, data analytics analyze huge, raw data sets and convert them into digestible formats. By using these formats, businesses get valuable insights that help them to make vital decisions.

Data Analytics Course Syllabus

Here is the data analytics course syllabus from IIT Roorkee –

Modules

Topics

1

  • Introduction to Business Analytics
  • Understanding Business Problems and Formulating Analytical Solutions
  • Tools and Technologies for Business Analytics
  • Spreadsheet Modelling

2

  • Foundations of Data Analysis in R
  • Types of Data
  • Different Sources of Data
  • Data Collection
  • Fundamentals on R

3

  • Exploratory Data Analysis & Data 
  • Visualisation in R
  • Descriptive Statistics
  • Building Hypothesis for Business Problems
  • Hypothesis Testing
  • Pareto Analysis
  • Storytelling with Data
  • Data Visualisation using GGPLOT
  • Text Analytics and Visualisation

4

  • Predictive Analytics in R
  • Regression
  • Classification
  • Forecasting
  • Clustering
  • Time Series Forecasting

5

  • Optimisation Techniques
  • Linear and Integer Optimisation
  • Sensitivity Analysis
  • Network Optimisation

6

  • Capstone Project

7

  • Assessment/Quiz

Advanced Data Analytics Course Syllabus

Topics

Sub-topics

Fundamentals of Data Analytics

  • Introduction to Data Science and its Application
  • The Data Analysis Process
  • Types of Data: Structured, Unstructured, Semi-Structured
  • Data Sources and Data Collection Techniques
  • Ethical Considerations in Data Analysis

Statistical Foundations

  • Descriptive Statistics: Measures of Central Tendency, Dispersion, and Shape
  • Probability and Probability Distributions
  • Inferential Statistics: Hypothesis Testing, Confidence Intervals
  • Regression Analysis: Linear and Multiple Regression

Overview of Excel

  • Basic Features in Excel
  • Formatting in Excel
  • Dealing with Raw Data
  • Functions in Excel

Deep Dive with Excel – II

  • Data Connectors in Excel
  • Cleaning in Power Query Editor
  • Adding Conditional Columns using Power Query Editor
  • Data Modelling and its Importance
  • Cardinality and Filter Direction in Power Pivot

Master Advanced Excel – III

  • Pivot Tables in Excel
  • Charts in Excel
  • Slicers in Excel
  • Measures in Excel
  • Creating a Dashboard in Excel

MySQL

  • Introduction to MySQL
  • Basic MySQL Syntax
  • Clauses in MySQL
  • Operators in MySQL
  • Dealing With Null Values in MySQL

Advanced SQL Queries and Functions in MySQL

  • Functions in MySQL
  • Case Operator in MySQL
  • Group By in MySQL
  • Having Clause in MySQL
  • Joins in MySQL

Advanced SQL Concepts and Techniques in MySQL

  • Subqueries in MySQL
  • Union, Intersect, Except in MySQL
  • Stored Procedures in MySQL
  • Common Table Expressions(CTE)
  • Window Functions in MySQL

Data Visualisation with Power BI

  • Introduction to Power BI
  • Data Connectors
  • Power Query Editor and Tools Power Query Editor
  • Append Queries and Merge Queries
  • Pivoting and Unpivoting of data

Advanced-Data Modeling and DAX in Power BI

  • Data Modelling and Cardinality
  • Cross Filter Direction
  • Measures vs Calculated Columns
  • Functions in DAX
  • Cumulative Sales and Moving Average Using DAX

Visualizations and Dashboard Creation in Power BI

  • ChatGPT for Measures
  • Column Charts and Slicers
  • Matrix vs Tables
  • Cards, KPI and Gauge Chart
  • Formatting a Dashboard

Data Visualisation with Tableau

  • Overview of Tableau Software
  • Connecting to Data Sources (Excel, CSV, Database)
  • Charts in Tableau
  • Sorting, Grouping, and Filtering Data
  • Using Colors, Labels, and Tooltips

Advanced Data Visualization and Storytelling with Tableau

  • Creating Geographic Maps
  • Adding Actions to Dashboards
  • Create Data Hierarchies
  • Using Tableau Stories to Create a Narrative
  • Sharing Dashboards and Visualizations

Maths & Applied Statistics

  • Introduction to Statistics
  • Descriptive Statistics
  • Hypothesis Testing
  • AB Testing
  • Fundamentals of Probability

Python Basics

  • Introduction to Python for Data Analytics
  • Datatypes and Variables
  • Operators in Python
  • Control Flow in Python
  • Data Structures in Python

Python Advance

  • Functions in Python
  • In-built Modules
  • Pickle Library
  • Introduction to Numpy
  • Statistical Functions in Arrays

Python Libraries – I

  • Introduction to Pandas
  • Cleaning Data with Pandas
  • Merge, concatenate and join – Pandas
  • Introduction to Matplotlib
  • Charts in Matplotlib

Python Libraries – II

  • What is WebScraping
  • BeautifulSoup and Requests Library in Python
  • Extracting Data from Tables
  • Extracting Data from Multi-Page Websites
  • Text Analysis using Python

Machine Learning – I

  • What is ML?
  • Applications of Machine Learning
  • Linear Regression
  • Decision Trees
  • Random Forests and Ensemble Methods

Machine Learning – II

  • Clustering Algorithms
  • Hierarchical clustering
  • Dimensionality Reduction
  • Cross-Validation Techniques
  • Evaluation metrics and ROC curves

AI for Data Analytics

  • Generating code & debugging errors
  • Exchanging Data Cleaning Skills
  • Crafting SQL queries
  • Optimizing Model Selection with AI-driven Methods
  • Utilizing AI for Anomaly Detection in Data Analysis

Big Data Technologies 

  • Introduction to Big Data concepts and challenges
  • Hadoop and MapReduce
  • Spark and PySpark
  • Cloud-based data analytics platforms

Domain-Specific Applications 

  • Analytics in Finance, Marketing, Healthcare, etc.
  • Business Intelligence and Reporting

Analyzing Significant Terms Related to Data Analytics Course

Here are some significant terms that aspirants should know to pursue a data analytics course –

1. Data Modeling

Data modeling is a method for mapping out data flow. It’s a simple visual diagram of software and its data elements, using texts and symbols to represent data and explain how data flows.

2. Data Accuracy

Data accuracy ensures that the collected data is correct and does not provide false information that harms businesses. Every company must have standard procedures to collect data and ensure consistency in data collection.

3. Data Mining

Data mining is a technique that involves machine learning and statistical analysis to detect patterns and valuable information from massive, raw data sets. It becomes fruitful to retrieve the most useful information, user behaviors, fraud detection, data filtration, and security breaches.

4. Data Monitoring

Data analysts regularly check data collection and storage to ensure that every piece of data meets the quality standard required by businesses. Data monitoring tools and techniques help businesses save time and money from manual monitoring.

5. Predictive Analysis

Predictive analysis, also known as predictive modeling, is a procedure that uses data to make predictions and assumptions about future outcomes. It uses data analysis, artificial intelligence (AI), machine learning (ML), and statistical models to detect patterns that forecast future behaviors.

6. Data Cleaning

When there are flaws and data are collected using poor methods, it requires some cleaning. Data cleaning is a procedure that removes inaccurate data and ensures data readability.

7. Data Extraction

Through data extraction, data is collected from sources, such as websites, APIs, databases, and more, with the aim of processing or storing it. Generally, the data remains unstructured at the time of extraction.

8. Data Validation

Data validation indicates that the collected data are meaningful and correct. Excel uses several rules as data validation tools. Users input those rules within the cells to validate data. This way, Excel restricts input data so that users do not make any mistakes.

9. Data Architecture

Data architecture refers to the complete plan of data flow within an organization. It includes the holistic data management approach from data collection to distribution and consumption. Data architecture sets a prototype of data and the path it flows from the data storage systems.

10. Data Democratization

Data democratization indicates that everyone can use data, regardless of technical skills. Thus, every business user can access and interpret data faster to make decisions.

11. Data Lake

It’s a storage solution that can handle numerous data types, such as structured, unstructured, and semi-structured, without modeling. Data Lake supports operations like reporting, analytics, AI, and ML. These activities can be hosted in the cloud or in data centers.

12. Business Intelligence (BI)

Business intelligence (BI) helps companies make data-driven decisions through business analytics, data visualization, data mining, infrastructure, and tools. Modern BI solutions support flexible self-service data analysis and governed data on trusted platforms, empowering users and providing accurate insights.

*tutorialspoint.com

Top Skills for Data Analytics

Here are the essential skills required for data analytics –

1. Programming Languages

Programming languages like Python, R, and SQL become essential in data analytics. These languages help with data visualization, statistical analysis, and data manipulation. 

  • Rich libraries like Pandas and NumPy in Python mainly help in data analysis and manipulation.
  • R programming language is widely used in statistical analysis, data visualization, and academic research. 
  • Structured query language or SQL allows users to manage large databases by using queries.

2. Statistical Analysis

Statistical analysis provides methodologies for making speculation from data.

  • Descriptive statistics interpret and summarize data to make it clear and feasible.
  • Hypothesis testing helps to evaluate hypotheses or theories with an aspect of solving practical problems.
  • Inferential statistics guide about finding conclusions from huge data samples.

3. Data Wrangling and Cleaning

Before conducting any data analysis, it should be cleaned and converted to usable format. This entire process is known as data wrangling. It includes – 

  • By using data learning, users can detect and correct errors, inaccuracies, and inconsistencies.  
  • Through data transformation, they can analyze data that may involve data aggregation and enrichment.
  • Data integration uses the techniques of collecting data from various sources and provides a centralized view.

Advanced Data Analytics Skills

After gaining mastery over the fundamental skills, people will explore more specialized areas. For these, they require these advanced data analytics skills –

1. Machine Learning (ML)

Machine learning in data analytics enables systems to learn from data. For data analytics, ML is used for –

  • Supervised learning: These techniques help build models for data prediction based on labeled data. 
  • Unsupervised learning: These techniques are an alternative to supervised learning. That means they can build models to predict data from unlabelled data. 
  • Natural language processing (NLP): NLP is a part of AI that ensures computers understand human languages.

2. Big Data Technologies

In this growing data volume and complexity field, big data technologies such as Hadoop and Spark become more demanding. According to a study by Statista, the big data market will reach USD 103 billion by 2027. 

These technologies help in –

  • Data storage: Big data enables the handling of enormous data sets that are beyond the capacity of classic data sets.
  • Data processing: These help to perform data analysis and complex computations.
  • Real-time analytics: Big data aids in real-time data analysis that accelerates business decisions. 

Data Analytics Tools

Apart from the programming languages, there are versatile data analytics tools. These are –

  • Microsoft Excel: Microsoft Excel incorporates some significant features for data analytics tasks. These include working with real-time collaboration, appending data into Excel directly from a photo, sharing workbooks, and more. 
  • RapidMinder: This tool helps build ML models. GO, Server, Studio, Radoop, and Real-Time Scoring are some potential RapidMiner products.
  • Tableau: This free tool allows working on a live data set. Automating data can reduce time spent on data wrangling. 
  • Power BI: It’s a Microsoft-based product that is used in business analytics. The top products of Power BI are Power BI Desktop, Power BI Report Server, Power BI Mobile, Power BI Embedded, and Power BI Pro. 
  • Apache Spark: Apache Spark is an open-source data processing engine for AI and ML apps that is backed by the largest big data open-source community. It’s designed to deliver lightning-fast computational speed, programmability and scalability for big data. 
  • KNIME: KNIME or Konstanz Information Miner is a free and open-source tool that supports data analytics, integration, and reporting. It has two platforms – the KNIME Server and KNIME Analytics. 
  • QlikView: It’s an all-in-one solution provider for data analytics, data visualization, and business intelligence. It includes numerous services and tools for free or on a 30-day subscription basis.
  • Splunk: This tool analyzes data collected from websites and applications. It is available as Splunk Free, Splunk Cloud, and Splunk Enterprise.

Duration and Eligibility of Data Analytics Courses Online

Generally, a full-time, distance online data analytics program takes 1 year to complete. Most of these courses are recognized for employment in the state and private sectors. However, the IIT Roorkee Data Analytics course is designed to be completed in 6 months. Numerous universities offer online data analytics courses through distance education. 

To become a data analyst, individuals must have a postgraduate or undergraduate degree in data analytics or related fields. These fields include big data, ML, AI, computer science, statistics, mathematics, and more. Here are the eligibility details for different data analytics courses.

Course 

Eligibility

Diploma or Postgraduate Diploma in Data Analytics

  • Graduated in science or engineering.
  • Had core subjects like maths/CS/statistics/IT.
  • Secured more than 50% marks in the qualifying exam.

Undergraduate Data Analytics Courses

  • Have cleared class 10 & 12 exams.
  • Secured 50%-60% or more marks in qualifying exams.
  • Have basic knowledge of maths, programming, and statistics.

Postgraduate Data Analytics Courses

  • Graduated in engineering or science.
  • Have basic to advanced knowledge of maths, programming, and statistics.
  • Got 50%-70% or more marks in the qualifying exam.
  • In some cases, work experience is required.

Data Analytics Course Fee

Data analytics course fee depends upon the type of courses the individuals are pursuing. For instance –

  • Data analytics course fee for general certification is ₹5000 – ₹10,000
  • Data analytics course fee for diploma is ₹9,300 – ₹2,00,000  
  • Data analytics course feeat the undergraduate level is ₹90,000 – ₹21,00,000
  • Data analytics course fee at the postgraduate level is ₹20,000 – ₹23,00,000


The
data analytics course fee for IIT Roorkee is ₹1,00,000 + GST of 18%.

Here is the complete breakdown of the plan.

Component

Instalment Schedule

Amount in ₹ (Including GST)

Registration Fee

Within 3 days of offer roll-out date

11,800

1st Instalment

Within 7 days of registration

41,300

2nd Instalment

5th May, 2022

41,300

3rd Instalment

5th July, 2022

23,600

Secure a Bright Future with IIT Roorkee’s Data Analytics Course

Individuals interested in data analytics courses can opt for the Post Graduate Certificate Programme in Applied Data Science & AI – IIT Roorkee, through a partnership with Jaro Education. Being the marketing and technology partner of IIT Roorkee, Jaro provides the value added services like dedicated student support, learning support from industry mentors, accessing alumni network of 350000+ professionals, and more for this program. 

This course provides an in-depth exposure to data analytics from the real-world applications of various domains. These include business, society, and economy. This course also helps candidates build skills in data science and AI fundamentals and gain hands-on experience in related technologies.

Conclusion

Data analytics is one of the most promising career choices as it will continue to be indispensable for business operations. With such high potential, the need for expert professionals will always rise, and aspirants can fulfill that with the right education. Hopefully, with knowledge of data analytics course fees and other particulars, students can now make the right choice and improve their employability.

Frequently Asked Questions

What is the mode of delivery for the IIT Roorkee data analytics course?

It includes two delivery modes: live online and campus immersions.

Who is eligible for this course?

Individuals who secured a bachelor’s degree from a recognized university with a minimum of 50% aggregate are eligible for this course. 1 year of work experience is preferable after completion of a bachelor’s degree.

What is the selection process for this course?

The selection process includes scrutiny of the individuals’ profiles, and the rest of the process will be rolling. For some applications, interviews might be conducted.

Trending Blogs

Leave a Comment