Cohort Analysis: Complete 2026 Beginner’s Guide

Table Of Content
- What is Cohort Analysis?
- Types of Cohort Analysis
- How to Use Cohort Analysis in Your Business
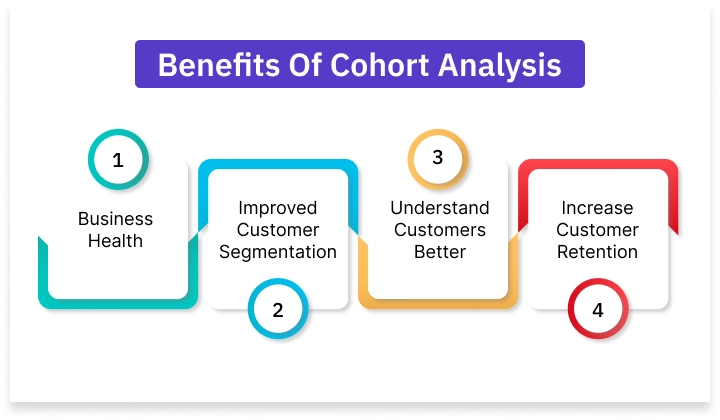
- How Cohort Analysis Helps Businesses And Why You Should Use It
Believe it or not, analysis comes before strategy. How? Let’s break it down. Have you ever wondered how businesses manage to influence almost every aspect of your interaction with their products or services? This is where Cohort Analysis comes in. Businesses enjoy using cohort analysis as one of their powerful tools because it’s like having a golden pass to get the best customer experience. But what’s the goal? To put simply, to find similarities and patterns in customer behaviour. Why? So that business can tailor their services and fulfil customers’ requirements to keep them coming.
In this simple guide, we will teach you everything you need to know about Cohort Analysis, including its meaning with an example, its types, and how to use Cohort Analysis. Stay tuned to learn more.
What is Cohort Analysis?
Cohort analysis is a strategy that involves analysing behaviours by grouping users with the same characteristics or starting point. If some users are signing up for your products on the same day, same month or hours, they are grouped under the same cohort. After this cohort retention analysis, markets use these data to recognise patterns and track to uncover users’ behaviour. This helps to identify drop-off points and implement improvements to increase growth and retention.
This process of cohort analysis is more impactful for understanding what is really working and what’s not.
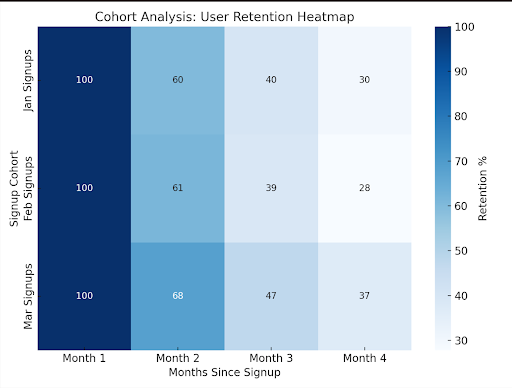
Let’s understand Cohort Analysis through an example: Suppose we have an e-commerce site that wants to analyse the behaviour of users who signed up in different months. The aim is to find out how buying power varies and to observe any spikes in churn based on the signup month of users.
In the cohort chart below, users are grouped based on when they were onboarded, so Month 1, Month 2, and Month 3. We are able to identify those who did purchase and the number of users who are now left in the last month or month 4. January signups had 100 total users, but only 30 remained active in month 4. February signups had a total of 45 users left in month 4, which suggests greater retention on average by feb users.
This analysis gives the company a glimpse of the retention pattern, allowing them to compare the purchasing behaviour of cohorts, and brings focus to when churn spikes. The company can now adjust marketing capabilities, improve onboarding, and propose features that will keep the users coming back.
Types of Cohort Analysis
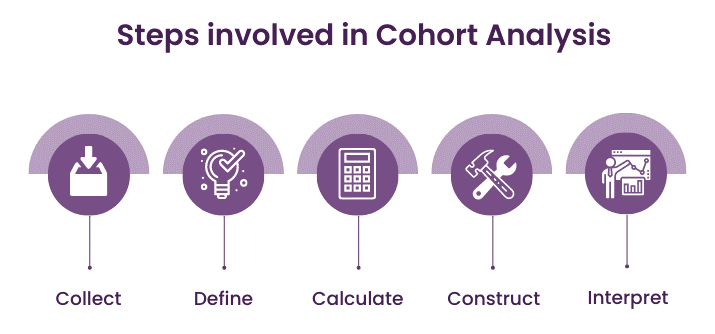
How to Use Cohort Analysis in Your Business
How Cohort Analysis Helps Businesses And Why You Should Use It
Common Mistakes in Cohort Analysis
Even experts in cohort analysis can run into errors. A frequent error is simply having cohorts which are too broad.
- For example, some people group their users together so there is no chance of recognising true differences in their behaviours upon grouping them.
- If you try to put together so many cohorts, you may also fall under the trap of overfitting, looking for patterns that don’t actually exist in your data.
- Poor data hygiene can also affect your cohort analysis. If you have records under the wrong dates, missing values, or incomplete records, these issues may lead to inaccurate results.
Therefore, it’s best to make sure your cohorts are clean, specific, and (again) connected to your business objectives. You want the insights you acquire to be as clean and useful as possible!
Final Thoughts
Cohort analysis is one of the most intelligent approaches to actually understanding your users. Without doubt, setting your cohorts up will take time, yes – it can feel daunting to think about putting your cohorts together, gathering data accurately, and analysing it consistently. But it is worth it.
If done the right way, cohort analysis provides valuable insights that help you make smarter decisions, improve retention, and accelerate business growth. To learn more about cohort analysis, explore the online courses available at Jaro Education. We offer a wide range of programs in data analysis, digital marketing, and product management.
Frequently Asked Questions
Choose a tool that fits your business needs. If you need basic tracking, Google Analytics works well. For deeper insights, platforms like Mixpanel, Amplitude, or Userpilot provide advanced cohort segmentation and retention tracking.
Don’t pick time periods that are too broad, as this hides important details. Avoid grouping users incorrectly or using incomplete data. Another mistake is focusing only on churn without studying what drives cohort retention analysis.
Traditional analytics gives you overall metrics, like total signups or active users. Cohort analysis digs deeper by grouping users over time, helping you see patterns in retention and behaviour.
Behavioural cohorts group users by actions, like completing onboarding or making a purchase. They reveal which behaviours lead to long-term engagement and which increase churn.

Find a Program made just for YOU
We'll help you find the right fit for your solution. Let's get you connected with the perfect solution.

Is Your Upskilling Effort worth it?

Are Your Skills Meeting Job Demands?

Experience Lifelong Learning and Connect with Like-minded Professionals

