


We are in 2025, where innovation and technology are advancing at the blink of an eye. This also makes the project management sector demand more efficiency and accuracy than ever before. And to achieve that, tools like network diagrams have become essential. The network diagram in project management is a powerful visual instrument that helps to simplify the complicated tasks within an organisation.
Whether it’s about any new technological product launches or highway construction duties, every company can make sure of a network diagram in project management to showcase task ordering and improve time control efficiency.
So, if you’re a project manager and you easily get a bit confused at the beginning of a project, this blog is for you. Here we will talk about everything about network diagrams, including what it is, their types, and their benefits.
A project management network diagram is a representation of all project-related tasks in a visual format that shows how they are connected and dependent on one another. The network diagram consists of tasks in boxes with directional arrows that present the sequence of operations. This also helps to plan timelines and manage resources more effectively. The network diagram in project management is based mainly on two principles,i.e., the Precedence Diagram Method (PDM) and the Arrow Diagram Method (ADM). Most of the businesses like to go with PDM because it offers more clearer visual representation and usability within the tools that support network diagrams. We will talk about these principles in more detail in this blog.
Note that using network diagrams in project management brings more structure and enhancements to make any project successful. Therefore, every project leader and manager needs to master what a network diagram is in project management and its real concept.
To thoroughly understand the network diagram in project management, understanding the key terminologies is important. So let’s look at some of the most essential terms one by one:
There are two main types of network diagrams in project management. They are:
*wrike.com
As the name suggests, the Arrow Diagram Method uses arrows to describe or represent activities in any project. These days, businesses do not rely on this type of network diagram in project management because of limitations. However, it is important to understand this diagram representation if it arises in your work environment.
In ADM (Arrow Diagramming Method):
For Example, if you plan to tile a floor (Activity C), you must first pour the concrete (Activity A) and obtain permits (Activity B). A and B aren’t dependent upon each other, but they both must finish before starting C; hence, a dummy activity is necessary to show that dependency.
But, in ADM, we cannot represent leads and lags in the same way without adding additional nodes and activities.
*wrike.com
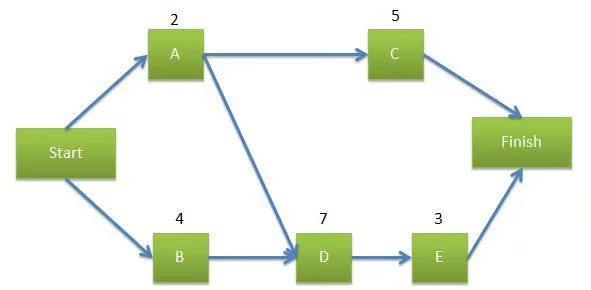
You will see that today’s project managers mostly prefer the use of the Precedence Diagram Method (PDM) as a network diagram tool for project planning and scheduling because of its flexibility and ease of understanding compared to older methods.
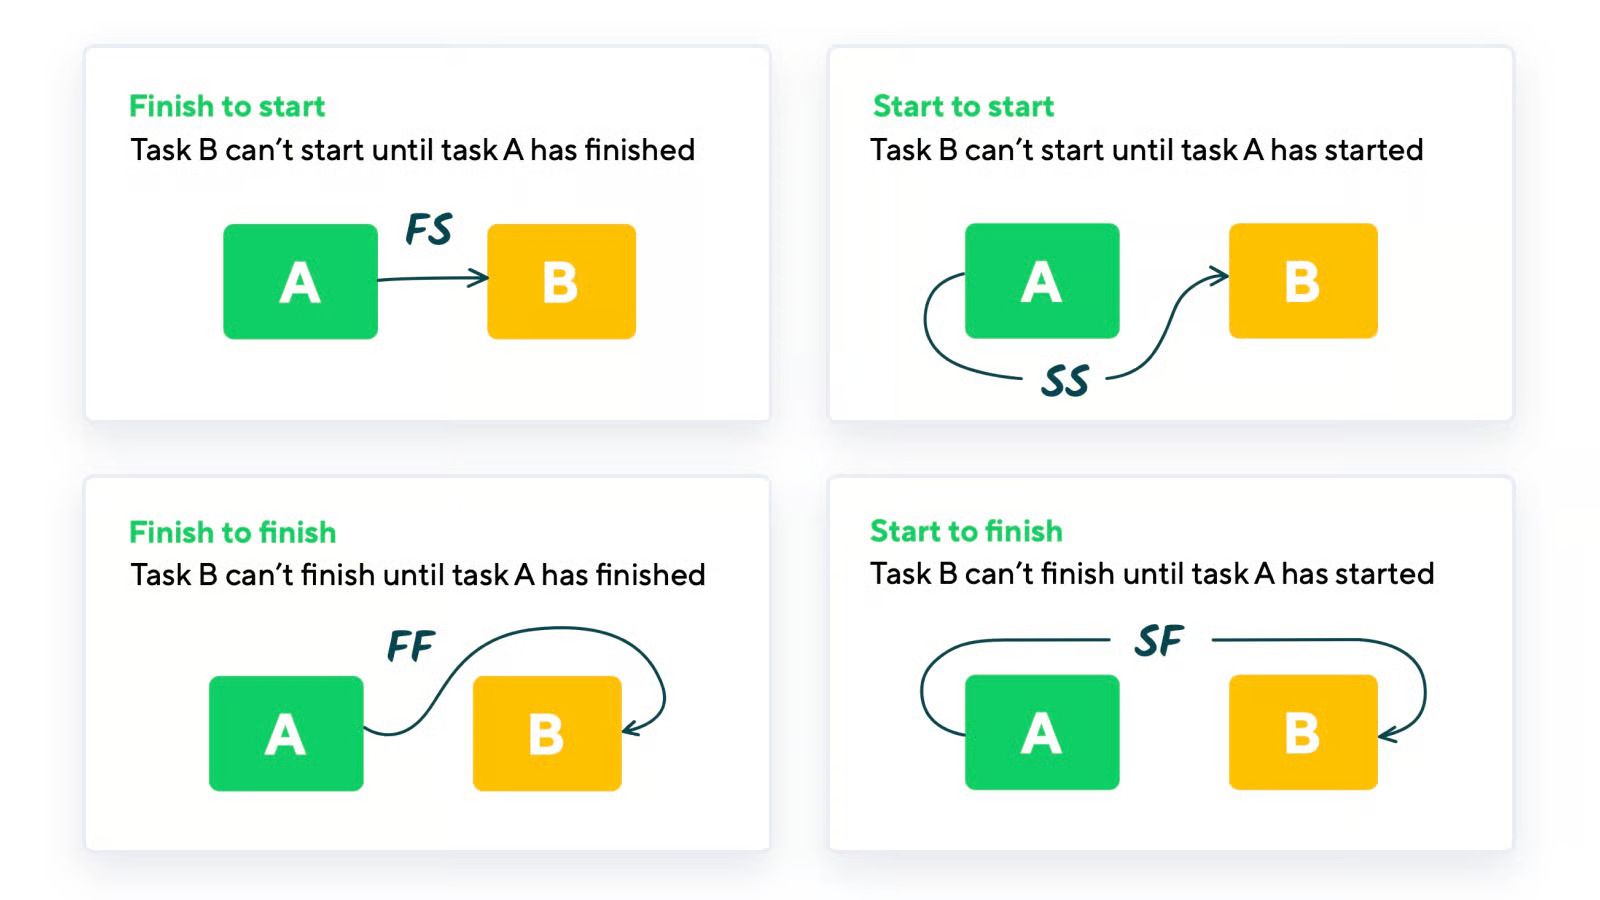
The Precedence Diagram Method uses boxes to represent activities and arrows to represent the relationships between activities. Its greatest strength is that PDM can support four task dependencies, which makes it one of the most useful tools available for project scheduling.
The forms of task dependencies used in the Precedence Diagram Method are as follows:
In the Precedence Diagram Method, you can also show the leads and lag times (wait or overlap time). For example, if a task has a 2-week lag time before it can start, you simply add the lag time on its connecting arrow.
Now you must have understood what is network diagram in project management and its types, so let’s see what the benefits are depending upon the specific project and its requirements.
The network diagram in project management serves as a map for the project. It visually connects all the activities so that managers, team members, and stakeholders can quickly get an overview of how the tasks are interconnected, instead of spending hours reading through long reports.
Sometimes, due to unwanted circumstances, a delay can happen anytime with a project. This is where a network diagram in project management can be a real saviour. It helps you to identify the delays before they happen. As the diagram represents the dependency of tasks, it is clear which task must finish before another task can begin. The team can plan ahead to avoid bottlenecks and keep moving forward.
There are always tasks in a project that rely upon previous tasks. A network diagram identifies those dependencies in a visual mode, to avoid the team making the error of beginning a task too soon or skipping steps during the process. It leads to much better coordination and teamwork.
Laying out all tasks in a network diagram ahead of time clarifies the project’s critical path. Managers will be able to see all of the tasks and where they have float (flexible time), and where they have no time to spare. A manager will be able to determine where to focus their attention to meet deadlines.
For some organisations, network diagrams in project management may not have been a critical component of project management in the past, but as we move into 2025, we would say it’s one of the most important parts of a project for having productive time management. Thus, understanding what network diagrams are and how to create them gives you the ability to better plan, understand what dependencies exist in your project.
Whether you are starting your project management career or are already a project management professional, the use of network diagrams is a stable solution for purposeful planning and efficient execution of projects. If you want to take your capabilities even further, you can join Jaro Education’s online courses to refine your project management expertise, which in turn will increase your confidence in managing complexity.
A network diagram in project management is a graphical representation of project tasks, showing the order and dependencies of project tasks. It is useful for project managers to plan timelines and allocate resources.
The most common network diagram in project management is created with tools like Microsoft Project; other examples include Lucidchart and Wrike.
The importance of network diagram in project management is that they can avoid bottlenecks, aid in scheduling, and provide clarity to the team.
ADM uses arrows for tasks, while PDM is comprised of boxes with more opportunities for dependencies.


Copyright © 2022 Jaro Education. All rights reserved.