The four data analytics types: descriptive, diagnostic, predictive and prescriptive support different stages of business decision-making.
Key data analytic tools include Excel, SQL, Python, R, Power BI and Tableau, each suited to different analytical requirements.
The data analytics scope continues to expand across industries, creating opportunities in data, business intelligence, finance, marketing and product roles.
Salary prospects in data analytics range from around ₹3.5–6 LPA for freshers to ₹20–35+ LPA for lead or managerial roles, depending on experience and skills.
AI data analytics is transforming the field by automating repetitive tasks, identifying patterns and supporting predictive analysis.
Data has become an important part of how businesses understand customers, measure performance and make decisions. However, collecting information is only useful when organisations can turn it into meaningful insights. Data analytics helps businesses examine data, identify patterns and use those findings to solve problems and improve outcomes. With growing adoption of AI, cloud platforms and digital technologies, analytics skills are becoming relevant across industries. This guide covers the major data analytics types, commonly used tools and the data analytics scope and career opportunities in 2026.
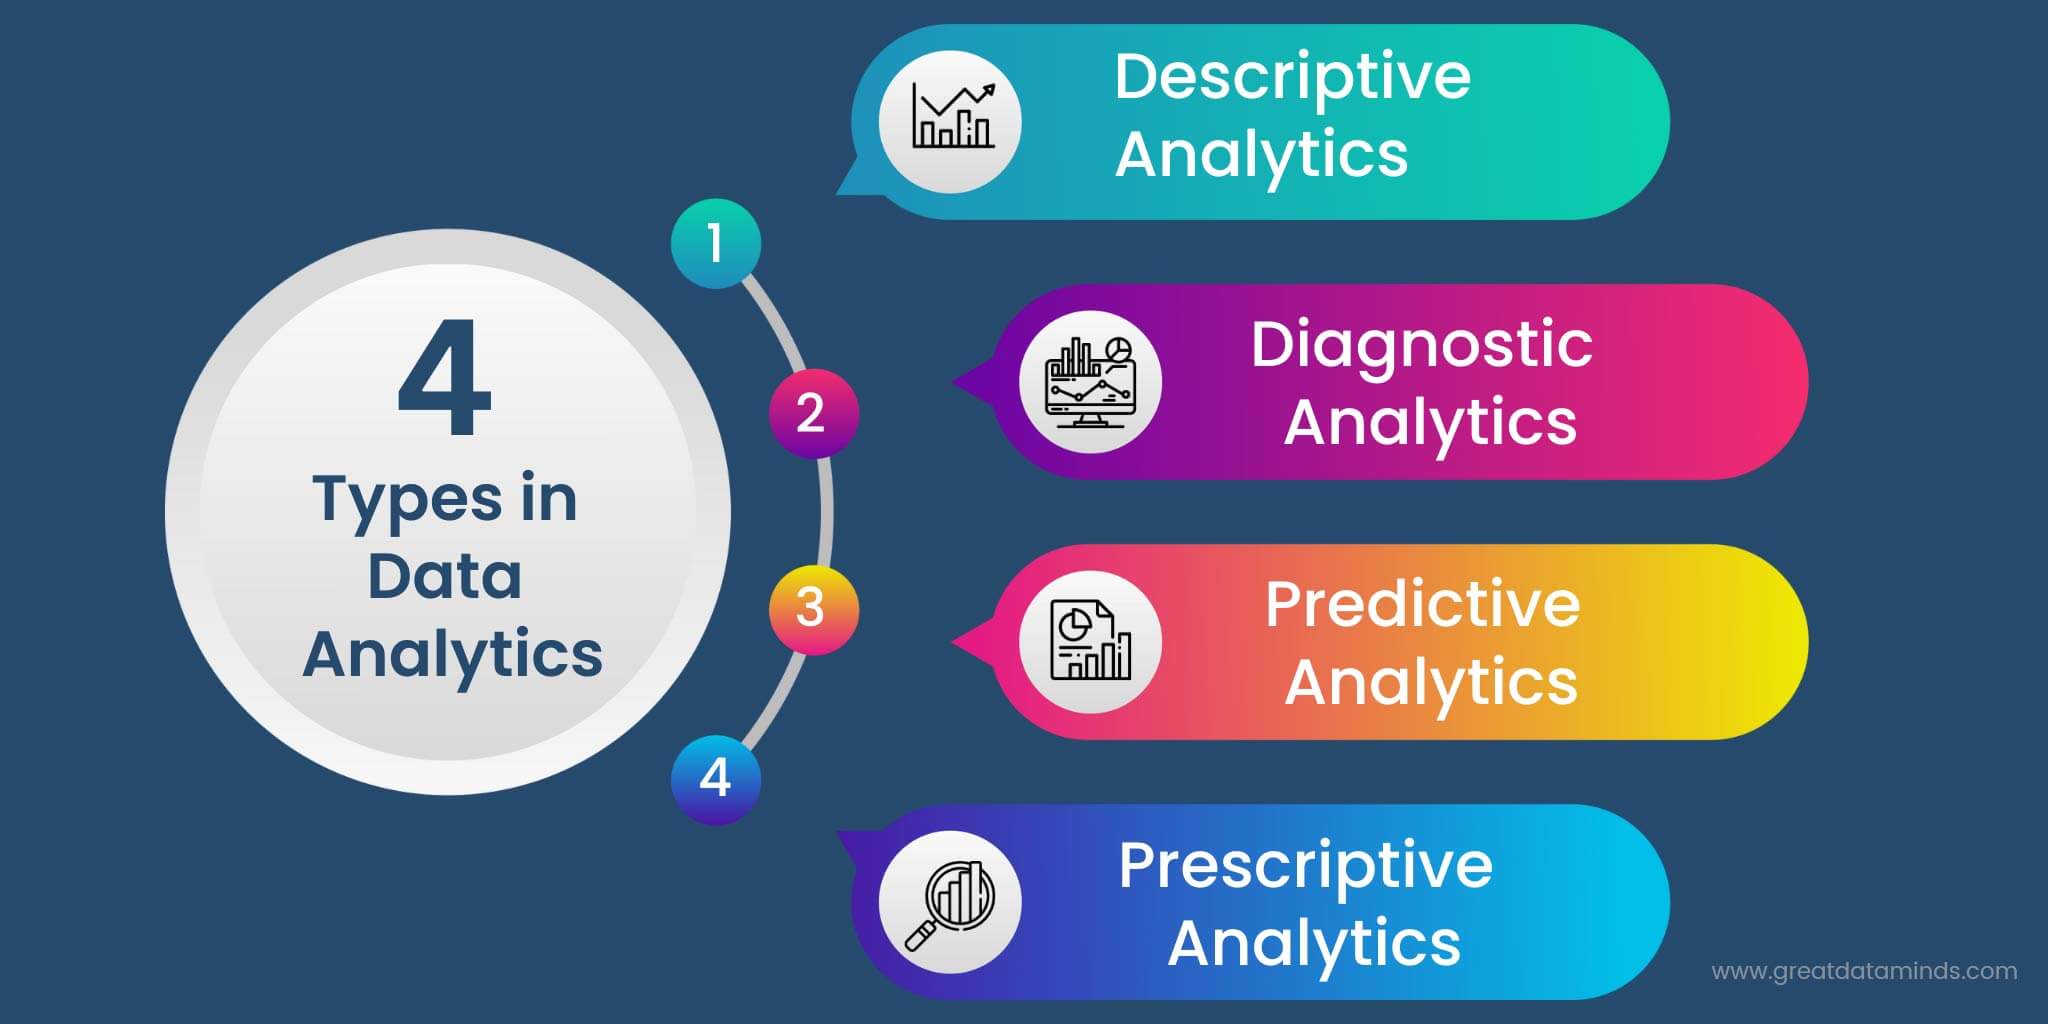
There are four main data analytics types: descriptive, diagnostic, predictive and prescriptive. Each type addresses a different question and can support businesses at different stages of decision-making.
Credit:hike2.com
1. Descriptive Analytics
Descriptive analytics focuses on what happened. It uses historical data to summarise business performance and identify trends over a particular period.
For example, an e-commerce company may analyse monthly sales, website traffic or order volumes to understand how its business performed. Dashboards, reports and performance summaries commonly use descriptive analytics.
It is often the starting point because businesses need to understand past and current performance before investigating why something happened or predicting what may happen next.
2. Diagnostic Analytics
Diagnostic analytics focuses on why something happened. It goes beyond reporting a result and examines the factors that may have contributed to it.
Suppose a company’s sales declined during a particular quarter. Diagnostic analysis could compare customer segments, product categories, pricing, marketing campaigns and regional performance to identify potential reasons for the decline.
This type of analysis is particularly useful when businesses notice unexpected changes and need to investigate their underlying causes.
3. Predictive Analytics
Predictive analytics asks what is likely to happen next. It uses historical data, statistical techniques and, in some cases, machine learning to identify patterns that can help estimate future outcomes.
Businesses can use predictive analytics for demand forecasting, customer churn, sales forecasting, fraud detection and inventory planning.
For example, a retailer could analyse previous purchasing patterns and seasonal trends to estimate future product demand.
4. Prescriptive Analytics
Prescriptive analytics focuses on what action should be taken. It builds on descriptive, diagnostic and predictive analysis by helping businesses evaluate potential decisions.
For instance, if predictive analysis suggests that demand for a product will increase, prescriptive analysis could help determine how much additional inventory should be ordered.
The four data analytics types can work together rather than functioning as completely separate processes. A business might first understand what happened, investigate why it happened, predict what could happen next and then evaluate the most suitable action.
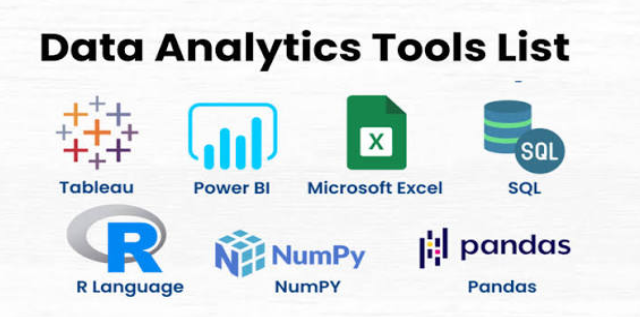
The choice of data analytic tools depends on the type and volume of data, the complexity of the analysis and the requirements of the organisation. Some tools are designed for spreadsheets and reporting, while others support database queries, programming, visualisation or advanced analytics.
1. Microsoft Excel
Excel remains one of the most accessible tools for working with structured data. Analysts can use formulas, filters, pivot tables and charts to organise information and identify trends.
It is particularly useful for beginners because it provides a straightforward introduction to data handling and analysis.
2. SQL
SQL, or Structured Query Language, is used to retrieve and work with data stored in relational databases. Analysts can use SQL to filter records, combine tables, calculate metrics and identify specific information within large datasets.
For many analyst roles, SQL is an important technical skill because organisations often store operational and customer data in databases.
3. Python
Python is widely used for data analysis, automation and more advanced analytical work. Libraries such as Pandas and NumPy support data manipulation, while visualisation libraries can help analysts present findings.
Python becomes especially useful when analysts need to work with larger datasets or automate repetitive analytical tasks.
4. R
R is a programming language widely associated with statistical analysis and data visualisation. It can be useful for statistical modelling, research and analytical projects that require more advanced statistical techniques.
5. Power BI
Microsoft Power BI is a business intelligence and visualisation tool that allows users to connect different data sources, create dashboards and present interactive reports.
It is often used to transform complex datasets into visual information that business teams can understand and use.
6. Tableau
Tableau is another widely used visualisation and business intelligence platform. It allows users to explore data and create interactive dashboards without requiring extensive programming knowledge.
Beginners do not need to learn every tool at once. A practical learning path could start with Excel and SQL, followed by Power BI or Tableau for visualisation. Python can then be added for more advanced analysis and automation.
The tools themselves are only part of analytics. Understanding the business problem, working with reliable data and communicating the resulting insight are equally important.
A modern data analytics platform may bring several of these capabilities together, including data integration, storage, processing, visualisation and reporting. Cloud-based platforms are also making it easier f
The data analytics scope has expanded considerably as organisations across industries use data to understand customers, monitor performance and improve decision-making. Analytics is no longer limited to technology companies. Banks, hospitals, retailers, manufacturers, consulting firms, logistics companies and media organisations all generate data that can be analysed.
This creates a broad data analytics career landscape for professionals with the right combination of technical and business skills.
Common Data Analytics Jobs
Some common data analytics jobs include:
Data Analyst: Analyses datasets, identifies trends and prepares reports or dashboards to support business decisions.
Business Analyst: Examines business requirements, processes and performance data to identify opportunities for improvement.
Business Intelligence Analyst: Works with reporting, dashboards and performance metrics to provide business insights.
Marketing Analyst: Uses customer and campaign data to evaluate marketing performance and understand consumer behaviour.
Financial Analyst: Analyses financial information to support forecasting, budgeting and business planning.
Product Analyst: Studies user behaviour and product performance to help organisations improve digital products and customer experiences.
The exact responsibilities can vary considerably between organisations, so candidates should review individual job descriptions rather than relying only on job titles.
Location can also influence salary levels, particularly in major technology and business hubs where demand for analytics professionals is higher.
City
Indicative Annual Salary
Bengaluru
₹7–14 LPA
Delhi-NCR
₹6–12 LPA
Mumbai
₹6–12 LPA
Hyderabad
₹6–12 LPA
Pune
₹5–10 LPA
Chennai
₹5–10 LPA
Note: Salary figures are indicative and may vary based on skills, qualifications, experience, company, industry, location and specific job role.
Industries Hiring Analytics Professionals
The growing use of digital systems means analytics skills can be applied across sectors such as:
Banking and financial services
Healthcare
E-commerce
Retail
Manufacturing
Telecommunications
Consulting
Logistics
Insurance
Education
This industry flexibility is one of the reasons the data analytics scope continues to attract students and professionals from different academic backgrounds.
AI and Data Analytics in 2026
Artificial intelligence is becoming an important part of modern analytics. AI data analytics can help automate repetitive tasks, identify patterns, detect anomalies, generate summaries and support predictive models.
This does not mean AI eliminates the need for analysts. Instead, the role is evolving. Professionals increasingly need to validate AI-generated outputs, understand data quality, identify misleading patterns and apply business context to analytical findings.
Knowledge of AI tools alongside traditional analytical skills can therefore become a valuable addition to an analyst’s toolkit.
Data analytics has become a core business capability, helping organisations understand performance, investigate problems, predict outcomes and make better-informed decisions. The field covers four major approaches, while tools such as Excel, SQL, Python, Power BI and Tableau support different stages of the analytical process.
In 2026, the data analytics career landscape is also expanding through AI, cloud computing and automation. For beginners, building strong foundations and applying them through practical projects can create a pathway towards roles across technology, finance, healthcare, retail, consulting and other industries. If you are looking to build your skills and explore opportunities in this field, Jaro Education offers a range of programmes designed to support different learning and career goals. You can explore the available courses and find a programme that aligns with your interests and professional aspirations.
Frequently Asked Questions
To become a data analyst, build a strong foundation in Excel, SQL, statistics and data visualisation. Learning Python or R, working on practical projects and developing business communication skills can further prepare you for entry-level analytics roles.
Skillup Data Analytics refers to structured learning that helps learners develop practical skills in areas such as data analysis, visualisation, databases and analytical tools. A suitable programme can help beginners build these skills through guided learning and practical application.
AI data analytics is helping automate repetitive tasks, identify patterns, detect anomalies and generate data-driven insights. Analysts still play an important role in validating AI outputs, understanding data quality and applying business context to the findings.
Commonly used data analytics tools include Excel, SQL, Python, R, Power BI and Tableau. Beginners can start with Excel and SQL before progressing to visualisation and programming tools
Data analytics skills can lead to roles such as Data Analyst, Business Analyst, Business Intelligence Analyst, Marketing Analyst, Financial Analyst and Product Analyst across industries including banking, healthcare, retail, e-commerce and consulting.]
Start with Excel, SQL, basic statistics and data visualisation before moving to advanced tools.
Data analytics companies are found across IT, banking, healthcare, e-commerce, retail, consulting and other data-driven industries.
Shubham Lal
Lead Software Developer
Shubham Lal joined Microsoft in 2017 and brings 8 years of experience across Windows, Office 365, and Teams. He has mentored 5,000+ students, supported 15+ ed-techs, delivered 60+ keynotes including TEDx, and founded AI Linc, transforming learning in colleges and companies.
Get Free Upskilling Guidance
Fill in the details for a free consultation
Related Courses
Explore our programs
Post Graduate Certificate Programme in Applied Data Science & AI

 October 15, 2025
 7 min read




 Key Insights
 ChatGPT
 Perplexity
 Claude
 Grok










 ROI Calculator