Ask a project team a simple question: "Who is doing what, and by when?" If the answer takes five minutes and three spreadsheets, the project has a visibility problem. A Gantt chart solves it with one picture.
This guide explains what a Gantt chart is, where it came from, what it contains and how it is used. You will also learn the main types, how to create one step by step, how to make a Gantt chart in Excel and how to choose a template.
A Gantt chart is a type of horizontal bar chart that illustrates a project schedule. Tasks are listed down the left side, a timeline runs across the top, and each task is a bar whose position and length show when it starts, how long it lasts and when it ends. Modern Gantt charts also show dependencies between tasks and current progress.
In plain terms, the Gantt chart meaning is “a visual project schedule.” It is part of the foundation of project management, used wherever people need to coordinate tasks, deadlines and resources, from construction and software releases to marketing campaigns and events.
The chart is named after Henry Laurence Gantt (1861 to 1919), an American mechanical engineer and management consultant who designed and popularised it around 1910 to 1915, according to Wikipedia’s entry on the Gantt chart. It was widely used for production planning, including in manufacturing during World War I.
However, a similar tool came earlier. In 1896, Polish engineer Karol Adamiecki developed the harmonogram to display interdependent production processes. He published mainly in Polish and Russian, which limited its reach, so the English-speaking world credits Gantt. Today, the idea lives on in nearly every project management tool.
Key Components of a Gantt Chart
Component
What it shows
Task list
The activities to be completed, often grouped into phases
Timeline
The calendar scale, in days, weeks or months
Task bars
Start, duration and end of each task
Milestones
Key checkpoints or deliverables, shown as markers
Dependencies
Links showing which tasks must finish before others start
Progress indicator
The share of each task completed
Today line
A vertical line showing the current date
Resources or owners
Who is responsible for each task
Uses and Benefits of Gantt Charts<
Planning: break work into tasks and sequence them logically.
Scheduling: see overlaps, gaps and the overall start and finish dates.
Communication: give stakeholders a single, easy-to-read plan. Our guide to stakeholder management explains why that matters.
Tracking: compare planned and actual progress and spot delays early.
Resource management: see who is overloaded and who is free.
Dependency management: understand which delays will push back the final date
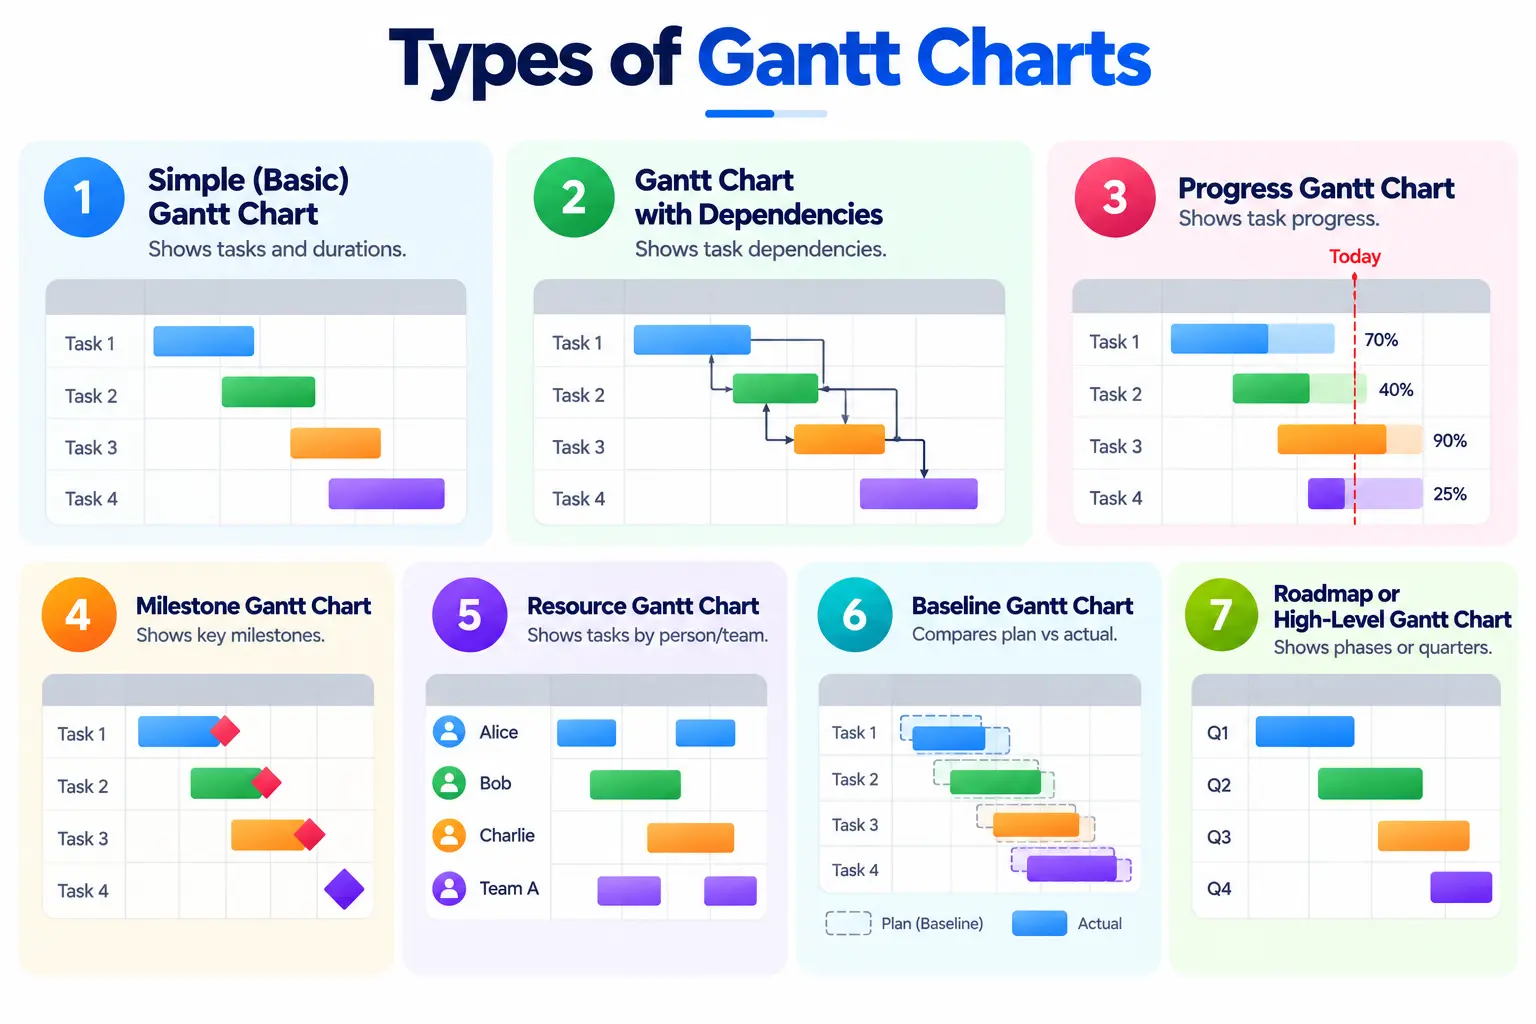
Types of Gantt Charts
1. Simple (Basic) Gantt Chart
Shows tasks and durations only. Good for small projects and quick plans.
2. Gantt Chart with Dependencies
Adds arrows between tasks to show which must finish before another starts. This is the standard for complex projects.
3. Progress Gantt Chart
Shades each bar to show the percentage complete, with a “today” line to see which tasks are behind.
4. Milestone Gantt Chart
Highlights key deliverables and decision points for executive reporting.
5. Resource Gantt Chart
Organises tasks by person or team to balance workloads.
6. Baseline Gantt Chart
Displays the original plan next to the actual schedule so you can measure variance.
7. Roadmap or High-Level Gantt Chart
A summary view by phase or quarter, often used for strategy and agile roadmaps.
How to Create a Gantt Chart: Step by Step
Define the goal and scope. Be clear about what the project must deliver. Our guide on setting SMART project objectives can help.
Break the work down. Create a work breakdown structure, grouping tasks into phases and deliverables. See our explainer on the work breakdown structure.
Estimate durations. Ask the people doing the work, and add buffers for uncertainty.
Identify dependencies. Decide which tasks must finish before others can start.
Assign owners and resources. Make sure every task has one accountable person.
Add milestones. Mark the checkpoints that matter to stakeholders.
Build the chart. Use Excel or project management software.
Save a baseline. Keep the original plan to compare against actual progress.
Update regularly. Review weekly, record actual dates and adjust the schedule.
As Microsoft explains, Excel does not have a predefined Gantt chart type, but you can simulate one by customising a stacked bar chart. Here is the step-by-step method.
Step 1: Set Up Your Data
Create a table with these columns: Task, Start Date, Duration (in days) and End Date. If you have start and end dates but no duration, calculate it with =End Date − Start Date + 1. Excel’s stacked bar needs the length of each bar, not the end date.
Step 2: Insert a Stacked Bar Chart
Select the Task and Start Date columns, then go to Insert, choose Bar Chart and select Stacked Bar under 2-D Bar.
Step 3: Add the Duration Series
Right-click the chart, choose Select Data, click Add and select the Duration column. Make sure Duration sits after Start Date in the series list.
Step 4: Hide the Start Date Bars
Click the first series (the Start Date part of each bar), open Format Data Series and set Fill to No Fill. Only the duration bars now remain visible.
Step 5: Reverse the Task Order
Click the task labels on the vertical axis, open Format Axis and tick “Categories in reverse order” so the first task appears at the top.
Step 6: Tidy the Timeline
Set the horizontal axis minimum to your project’s start date (as a serial number if needed), reduce the gap width between bars and delete the legend.
Step 7: Add Progress or Milestones
Add a “Days Complete” series with a different colour to show progress, or use conditional formatting for a colour-coded grid instead of a chart. To work faster with dates and formulas, see our lists of Excel formulas.
Gantt Chart Templates
A template saves time because the formulas and formatting are already set up. Microsoft and many project tools offer free Gantt chart templates for Excel and Google Sheets. When choosing one, check that it:
Has columns for task, owner, start date, duration, end date and percentage complete.
Updates the bars automatically when you change dates.
Supports milestones and dependencies, or at least clear notes about them.
Lets you change the timeline scale (days, weeks or months).
Is simple enough that your team will actually update it.
Sample Gantt Chart Template and Example
Here is a simple project table you can copy into a spreadsheet. The example is a website launch, with illustrative dates.
Task
Owner
Start
Duration (days)
End
Depends on
Status
Requirements and scope
Product lead
1 Mar
5
5 Mar
None
Done
Design mockups
Designer
6 Mar
7
12 Mar
Requirements
Done
Development
Developer
13 Mar
14
26 Mar
Design
In progress
Content writing
Writer
13 Mar
10
22 Mar
Design
In progress
Testing
QA
27 Mar
5
31 Mar
Development
Not started
Launch
Product lead
1 Apr
1
1 Apr
Testing
Not started
Notice that development and content writing run in parallel, which a Gantt chart displays clearly. The critical path, meaning the chain of tasks that sets the earliest finish date, runs through requirements, design, development, testing and launch.
Gantt charts are powerful but not perfect. They can look precise while hiding uncertainty, they can become cluttered on large projects and they need constant updating. Follow these practices:
Keep it readable: group tasks into phases and show detail only where needed.
Use realistic estimates: involve the team and add contingency.
Show dependencies: a schedule without them is only a wish list.
Review often: a Gantt chart that is not updated misleads.
Pair it with other tools: use risk logs, status reports and stakeholder updates alongside it.
Gantt Charts in Project Management Software and AI
Most project tools generate Gantt charts automatically, update them when dates change and highlight the critical path. Compare options in our guide to the best project management tools. AI features are also appearing, such as draft schedules and risk alerts, which our article on AI and generative AI in project management explores. Always review AI-generated schedules before using them.
Skills and Careers: Using Gantt Charts Professionally
Scheduling is a core skill for project managers, programme managers and operations leaders. To see which certifications and roles build on it, read about project management courses and certifications.
Conclusion
A Gantt chart turns a list of tasks into a shared picture of the schedule. Build it from a clear work breakdown, add dependencies and milestones, save a baseline and keep it updated. Use Excel for small projects and dedicated software as complexity grows.
If you want to go beyond charts and learn to plan, schedule, analyse and lead complex projects, the IIM Mumbai Executive Certificate Programme in Advanced Project Management and Analytics is a blended programme with live online Sunday sessions and campus immersion, designed for graduates with at least three years of work experience. Its curriculum covers project planning and scheduling, project analytics, risk analytics, agile project management, digital technologies including AI, and hands-on sessions on project management software, along with a capstone project. Check the programme page for current dates, duration and fees.
Frequently Asked Questions
A Gantt chart is a horizontal bar chart that shows a project’s tasks along a timeline, with each bar’s position and length showing when the task starts and how long it lasts.
In project management, it means a visual schedule that helps teams plan, coordinate and track tasks, dependencies and milestones.
Henry Gantt popularised it around 1910 to 1915. A similar tool, the harmonogram, was developed earlier by Karol Adamiecki in 1896.
Create a table with task, start date and duration, insert a stacked bar chart, add the duration series, set the start-date series to no fill and reverse the task order.
No. Excel has no predefined Gantt chart type, but you can simulate one with a stacked bar chart or use a ready-made template.
Microsoft offers free Excel templates, and many project tools and spreadsheet sites provide Excel and Google Sheets versions. Choose one with automatic bars and clear columns.
A task list, timeline, task bars, milestones, dependencies, progress indicators and, often, owners and a today line.
Avoid relying on it alone for highly uncertain, fast-changing work such as pure agile development, where backlog and sprint tools fit better, though a high-level roadmap Gantt can still help.
Shubham Lal
Lead Software Developer
Shubham Lal joined Microsoft in 2017 and brings 8 years of experience across Windows, Office 365, and Teams. He has mentored 5,000+ students, supported 15+ ed-techs, delivered 60+ keynotes including TEDx, and founded AI Linc, transforming learning in colleges and companies.
Get Free Upskilling Guidance
Fill in the details for a free consultation
Related Courses
Explore our programs
Advanced Strategy for Products and Marketing - Advanced Analytics for Products and Marketing

 October 25, 2026
 7 min read





 ChatGPT
 Perplexity
 Claude
 Grok










 ROI Calculator