What Is R Programming? Features, Uses & Career Scope in 2026
J
By Shubham Lal
October 2, 20267 min read
Published on October 2, 2026
SHARE THIS ARTICLE
Table Of Content
What Is R Programming?
Key Features of R Programming
R in C Programming: How Are They Connected?
R vs Python: Which Should You Learn?
Key Insights
R programming is a free, open-source language and environment built for statistical computing, data analysis and graphics.
R's strength lies in its package ecosystem: CRAN alone hosts more than 24,000 packages, including the tidyverse for data work and ggplot2 for visualisation.
R is used in healthcare and pharma, finance, marketing analytics, and academic research, and is the language behind the R Consortium's pilots for FDA submissions.
R and Python are complementary rather than rival skills: R leads on statistics and reporting, while Python leads on general-purpose and AI work.
Careers that use R include data analyst, statistician, statistical programmer and data scientist, and pay depends heavily on the mix of R, SQL, BI and domain skills.
In this blog, you'll learn what R programming is, its features, how it relates to C, its industry uses, career scope, and a step-by-step roadmap to learn R programming.
R programming is one of the most established tools for statistics, data analysis and visualisation, and it remains widely used in 2026 across research labs, hospitals, banks and analytics teams. If you are exploring a data career, you have probably seen R mentioned alongside Python, SQL and Tableau, and wondered whether it deserves a place on your learning list.
This guide explains what R programming is, where it came from, its main features, how it relates to C, where it is used, and how it compares with Python. It also covers the career scope in Indiaand a practical roadmap to help you learn R programming from scratch.
R is a free, open-source language and software environment for statistical computing and graphics. According to the R Project, it supports a wide range of techniques, including linear and nonlinear modelling, classical statistical tests, time-series analysis, classification and clustering, and it is highly extensible.
The phrase “language R programming” describes this dual nature well. R is a complete programming language with conditionals, loops and user-defined functions, but it is also an environment where data import, calculation and plotting happen in one place. Analysts do not have to switch between separate tools for each step.
A Brief History of R
R was created by Ross Ihaka and Robert Gentleman at the University of Auckland, originally to teach statistics. It was inspired by the S language from Bell Laboratories, and the name reflects both the authors’ first initial and its place next to S in the alphabet.
Going by R’s documented history, the first binaries were published in 1993, R became open-source software under the GPL in 1995, CRAN was founded in 1997, and R 1.0.0 was released on 29 February 2000. The latest release documented on CRAN at the time of writing is R 4.6.1, dated June 2026.
R is free to download and use, and it runs on Windows, macOS and Linux. This removes licensing costs for students, startups and researchers, and it lets teams share the same code across machines.
Depth in Statistics and Modelling
R grew out of the statistics community, so techniques such as regression, hypothesis testing and time-series analysis are available natively or through well-tested packages. If statistics is new to you, our guides to statistics for data science andhypothesis testing are useful companions.
A Vast Package Ecosystem
The CRAN repository hosts more than 24,000 packages, organised into 49 task views that guide you to the right tools for a given topic. The tidyverse is the best-known collection: it bundles packages such as dplyr for data manipulation, tidyr for tidying data, readr for importing data and ggplot2 for graphics under one consistent design.
Strong Data Visualisation
ggplot2 builds charts using the Grammar of Graphics: you map variables to visual properties and R draws the plot. It is a big reason analysts use R for exploratory work. To see how visuals fit the wider workflow, read our guide to data visualisation in data science.
Reproducible Reporting and Interactive Apps
With R Markdown, Quarto and Shiny, you can combine code, results and commentary in a single report or turn an analysis into an interactive web app. This makes your work easier to review, repeat and share with non-technical stakeholders.
R in C Programming: How Are They Connected?
Learners who search “r in c programming” usually mean one of two things, so it helps to separate them.
R is built on C. R is implemented mainly in C, Fortran and R itself. Performance-critical routines run as compiled code while you write high-level R. When a task is too slow in R, developers can write C code and call it from R, as described in the official “Writing R Extensions” manual on CRAN. The Rcpp package offers a similar bridge to C++.
The “\r” in C is unrelated. If you were looking at C source code, \r is the carriage return escape sequence. It has nothing to do with the R language. To strengthen your C fundamentals, see our guides on C vs C++ and the future of C programming.
Comfortable for statisticians, quirky for programmers
Readable and beginner-friendly
Typical domains
Pharma, biostatistics, academia, analytics
Tech, AI/ML, product analytics, web
Visualisation
ggplot2
Matplotlib, Seaborn
On popularity, TIOBE’s index still places Python far ahead, but InfoWorld reported that R climbed back into TIOBE’s top 10, moving from 27th to 10th between September 2024 and September 2025. TIOBE tracks search-based popularity, not code quality or job demand, so treat it as a signal rather than a verdict.
R is well established in clinical research. The R Consortium’s R Submissions Working Group has run a series of pilots with the FDA to test R-based clinical trial submission packages, covering tables, figures, datasets and Shiny apps. Bioconductor also provides packages for genomic data analysis. For the wider picture, see our blog on big data analytics in healthcare.
Teams use R for customer segmentation, campaign measurement and demand analysis, often with k-means clustering and dashboards built in Shiny. Our guide to marketing analytics shows how these methods are applied.
Academia and Research
Because R was designed for teaching and analysing statistics, it is common in universities, and its reproducible reports suit academic publishing. See our overview of statistical analysis methods and applications.
Career Scope of R Programming in 2026
R skills are most valuable in roles where statistical rigour matters. Common job titles include:
Data Analyst
Statistician or Biostatistician
Statistical Programmer (especially in pharma and clinical research)
Data Scientist
Research Analyst
Business Intelligence or Analytics Consultant
Job listings on Glassdoor India include statistical programming roles that ask for R alongside knowledge of FDA regulations, which shows where demand is concentrated.
Salary data specific to R is patchy. Glassdoor’s R Programmer page shows a typical range of ₹3–6 lakh per year, but it rests on very few submissions, so treat it as a rough guide. Pay is driven more by skill combinations, domain and experience than by the language alone. For broader benchmarks, read our data analyst salary guide and data scientist role, skills and salary overview.
How to Learn R Programming: A Step-by-Step Roadmap
1. Set Up Your Tools
Install R from CRAN and use an IDE such as RStudio. Both are free.
2. Learn the Basics
Cover vectors, data frames, functions, conditionals and loops. Practise on small datasets until reading and writing R code feels natural.
3. Work with the Tidyverse
Learn to import, clean, transform and plot data with dplyr, tidyr and ggplot2. The free book R for Data Science, recommended on the tidyverse site, is a good reference.
R is not the right tool for everything. It typically holds data in memory, so very large datasets need extra planning. It is less common than Python for general software development and production deployment, and its syntax can feel unusual to people coming from other languages. Knowing these trade-offs helps you choose R for the right tasks.
Conclusion
R programming remains a strong choice if your work involves statistics, research or reporting. Its open-source foundation, deep package ecosystem and clear visualisation tools make it useful in pharma, finance, marketing and academia, and its link with C shows how much engineering sits beneath the simple code you write.
If you want to learn R programming, start with the basics, practise on real data, and add SQL, BI and Python as you progress. To turn these skills into a career, explore the analytics and data science courses at Jaro Education.
Frequently Asked Questions
R programming is used for statistical analysis, data cleaning, visualisation, modelling and reporting. Common users include data analysts, biostatisticians, researchers and data scientists in pharma, finance, marketing and academia.
Both. R is a programming language, and it is also a software environment that includes tools for data handling, calculation and graphics. That is why it is described as a language and environment for statistical computing.
Not usually if you have some statistics background. The syntax can feel unusual to people coming from other languages, but the tidyverse, RStudio and abundant free resources make it manageable for beginners.
Neither is better overall. R is strong for statistics, visualisation and research reporting, while Python is stronger for general-purpose development and AI. Many analysts learn both.
Yes. R is actively maintained, with version 4.6.1 released in June 2026, and CRAN hosts more than 24,000 packages. It is also used in FDA-related clinical submission pilots.
It can mean two things. The R language is implemented mainly in C, Fortran and R itself, and it can call C code. Separately, \r in C is the carriage return escape sequence, which is unrelated to R.
Yes. Start with vectors, data frames and simple functions in RStudio, then move to the tidyverse and small projects. A statistics foundation helps more than prior coding experience.
You can explore roles such as data analyst, statistician, biostatistician, statistical programmer, research analyst and data scientist. Employers usually expect R to be combined with SQL, BI tools and domain knowledge.
Shubham Lal
Lead Software Developer
Shubham Lal joined Microsoft in 2017 and brings 8 years of experience across Windows, Office 365, and Teams. He has mentored 5,000+ students, supported 15+ ed-techs, delivered 60+ keynotes including TEDx, and founded AI Linc, transforming learning in colleges and companies.
 HOME > BLOG > Data Science and BI Analytics > What Is R Programming? Features, Uses & Career Scope in 2026
 October 2, 2026
 7 min read





 Key Insights
 ChatGPT
 Perplexity
 Claude
 Grok
Grok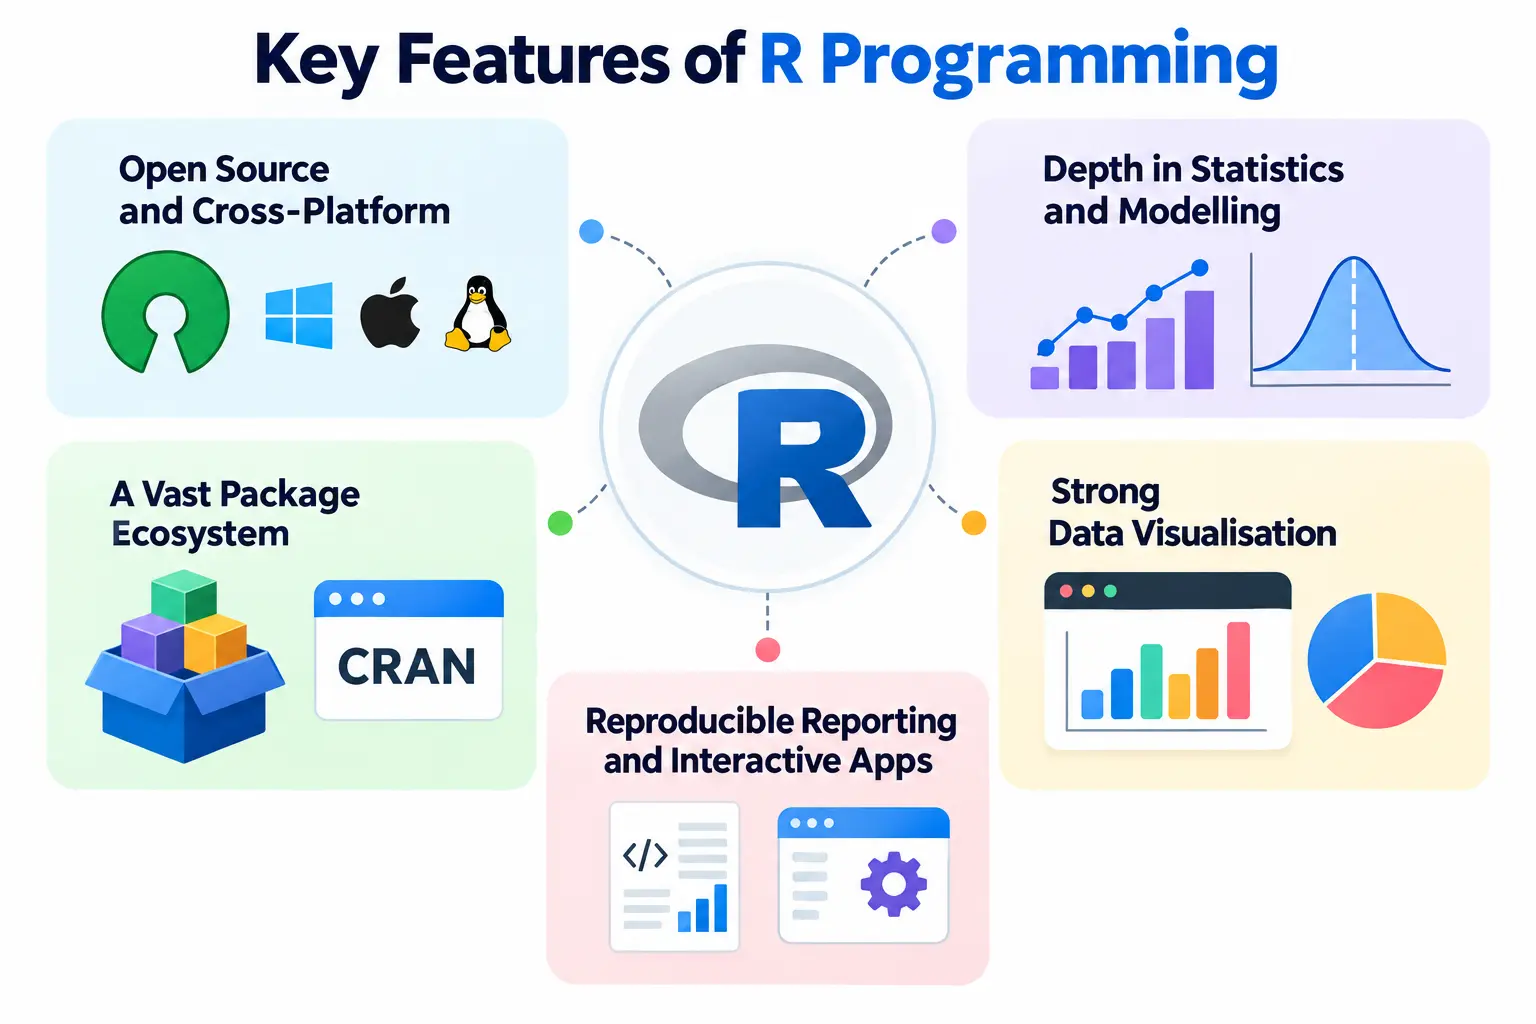











 ROI Calculator