What Happens When the Price Is Not at Equilibrium?
Key Insights
Market equilibrium is the point where the quantity buyers want to purchase equals the quantity sellers want to supply, so the market clears with no pressure for the price to change.
To find market equilibrium, set quantity demanded equal to quantity supplied and solve for price, then substitute that price back to get the equilibrium quantity.
Above the equilibrium price there is a surplus, which pushes prices down. Below it there is a shortage, which pushes prices up.
Equilibrium shifts when demand or supply changes. A rise in demand raises both price and quantity, while a fall in supply raises price but lowers quantity.
The main types are stable and unstable, partial and general, static and dynamic, and short-run and long-run equilibrium.
In this blog, you'll learn the meaning of market equilibrium, how to calculate it, what happens when prices move away from it, its types, real examples and why managers rely on it.
Why do onion prices jump after a poor harvest, then fall when fresh stock arrives? Why does a popular concert sell out at the listed price while an unpopular one sits half empty? Behind these everyday stories sits one of the most useful ideas in economics: market equilibrium.
For MBA studentsand managers, it is more than a textbook topic. It explains how prices form, how markets react to shocks and why pricing and forecasting decisions succeed or fail. This guide covers the meaning of market equilibrium, how to find it with a worked example, its types, real-world examples and its limits.
If you are asking what market equilibrium is in economics, here is the simple answer: market equilibrium is the situation in which the quantity demanded by buyers equals the quantity supplied by sellers at a particular price. That price is the equilibrium price, and the matching quantity is the equilibrium quantity. At this point, the market “clears”: every buyer willing to pay the price finds a seller, and every seller willing to sell at that price finds a buyer.
As the OpenStax Principles of Economics textbook puts it, the equilibrium is where the demand and supply curves intersect, and it is the only price at which quantity demanded equals quantity supplied.
Key Features of Market Equilibrium
Quantity demanded equals quantity supplied: there is neither a shortage nor a surplus.
No pressure to change: buyers and sellers have no incentive to alter their behaviour, as long as nothing else changes.
One price clears the market: in a standard model with a downward-sloping demand curve and an upward-sloping supply curve, there is a single equilibrium price.
Equilibrium is built from two forces. Demand shows how much buyers want at each price, and as price rises, quantity demanded generally falls. This reflects diminishing satisfaction from each extra unit, an idea explained in our guide to total and marginal utility. Supply shows how much sellers offer at each price, and as price rises, quantity supplied generally rises because production becomes more profitable.
Plot both curves on the same graph, with price on the vertical axis and quantity on the horizontal axis. Where they cross is the equilibrium. This framework belongs to microeconomics, which studies individual markets, as our explainer on microeconomics vs macroeconomics shows.
How to Find Market Equilibrium
There are three ways to find market equilibrium: from a table, from a graph or by algebra.
Method 1: Using a Schedule
List the quantity demanded and supplied at different prices, and find the price at which they are equal.
Method 2: Using a Graph
Draw the demand and supply curves and read the price and quantity at their intersection.
Method 3: Using Equations
This is the most precise method and the one most MBA exams use. Follow these steps:
Write the demand equation (Qd) and the supply equation (Qs).
Set Qd = Qs.
Solve for price (P). This is the equilibrium price.
Substitute P into either equation to find the equilibrium quantity (Q).
Check by confirming that Qd and Qs match.
Worked Example
Suppose the market for a product has these equations, with price in ₹ per kg and quantity in thousand kg:
Demand: Qd = 100 − 2P
Supply: Qs = 20 + 3P
Set them equal: 100 − 2P = 20 + 3P. Rearranging gives 80 = 5P, so P = ₹16. Substituting into demand gives Q = 100 − 2(16) = 68 thousand kg. Check with supply: 20 + 3(16) = 68. The numbers match, so the equilibrium is ₹16 and 68 thousand kg.
The schedule below shows what happens around that price:
Price (₹)
Qd
Qs
Result
10
80
50
Shortage of 30
14
72
62
Shortage of 10
16
68
68
Equilibrium
18
64
74
Surplus of 10
20
60
80
Surplus of 20
Free Courses
Free FinTech Course – FinTech 101: Digital Banking & Payments
What Happens When the Price Is Not at Equilibrium?
If the price is above equilibrium, quantity supplied exceeds quantity demanded, creating a surplus, or excess supply. Sellers are left with unsold stock, so they cut prices, and the price drifts down. If the price is below equilibrium, quantity demanded exceeds quantity supplied, creating a shortage, or excess demand. Buyers compete for limited stock, and the price drifts up. In both cases, the movement continues until the price reaches equilibrium.
Situation
Condition
Pressure on price
Surplus
Price above equilibrium, Qs > Qd
Downward
Shortage
Price below equilibrium, Qd > Qs
Upward
Equilibrium
Qd = Qs
None
How Equilibrium Shifts When Demand or Supply Changes
Markets are never static. Income, tastes, input costs, technology and expectations keep moving the curves. OpenStax recommends a four-step process: sketch the original market, decide whether the event affects demand or supply, decide whether the effect is positive or negative and draw the shifted curve, then compare the new equilibrium with the old.
Change
Equilibrium price
Equilibrium quantity
Demand increases
Rises
Rises
Demand decreases
Falls
Falls
Supply increases
Falls
Rises
Supply decreases
Rises
Falls
Both demand and supply increase
Uncertain
Rises
Demand rises, supply falls
Rises
Uncertain
Be careful to separate a change in quantity demanded, which is a movement along the curve caused by price, from a change in demand, which is a shift of the whole curve caused by other factors. Businesses estimate such shifts using demand forecasting.
Types of Market Equilibrium
Stable and Unstable Equilibrium
In a stable equilibrium, if the price is disturbed, market forces bring it back. In an unstable equilibrium, a small disturbance pushes the market further away. Stable equilibrium is the usual assumption for ordinary goods.
Partial and General Equilibrium
Partial equilibrium looks at one market while assuming everything else is constant, such as the market for tea. General equilibrium studies all markets at once and how they affect one another, for example how a change in fuel prices affects transport, food and housing markets.
Static and Dynamic Equilibrium
Static analysis compares equilibrium positions at a point in time, ignoring how the market gets there. Dynamic analysis studies the adjustment process over time, including delays and expectations.
Short-Run and Long-Run Equilibrium
In the short run, supply is limited because firms cannot fully adjust capacity. In the long run, firms can enter or leave and change scale. In perfect competition, long-run equilibrium typically leaves firms earning only normal profit. See our guide to perfect competition features and examples.
Equilibrium in Different Market Structures
Price formation depends on the structure of the market. In perfect competition, many firms take the market price as given. In monopoly, a single firm chooses output where marginal revenue equals marginal cost and can set a price above marginal cost. Learn more in our articles on types of markets in economics and market structure.
Market Equilibrium Examples
Fresh produce: after a poor harvest, supply shifts left, so the equilibrium price of vegetables typically rises and quantity falls. A bumper harvest does the opposite.
Ride-hailing: during a rainstorm, demand spikes while supply is limited, so fares rise until the extra demand is balanced.
Smartphones: as production costs fall and more brands compete, supply increases, so prices tend to fall while quantity sold rises.
Housing rentals: a rise in demand for homes near a new business district pushes rents up until more units are built.
Government Intervention: Price Ceilings and Floors
Governments sometimes override market prices. A price ceiling is a legal maximum price. If it is set below equilibrium, as in strict rent control, quantity demanded exceeds quantity supplied and a shortage results. A price floor is a legal minimum price. If it is set above equilibrium, quantity supplied exceeds quantity demanded and a surplus results. Support prices for farm produce work in this way when authorities buy the extra supply. Policymakers weigh the trade-offs between helping producers or consumers and the market distortions that follow, a topic connected to our guide on fiscal policy in India.
Why Equilibrium Is an Efficient Outcome
At equilibrium, consumer surplus (the gap between what buyers would pay and the price) plus producer surplus (the gap between the price and sellers’ costs) is at its maximum. OpenStax notes that total surplus is larger at the equilibrium price and quantity than at any other. That is why economists treat equilibrium as an efficient benchmark, even if it is not always fair.
Forecasting: anticipating shifts in demand and supply guides inventory and production.
Strategy: market structure shapes competition and margins.
Scenario analysis: managers ask “what happens if costs rise or a competitor enters?”
For how economics supports business decisions, read about the role of managerial economics. Price levels across the whole economy are also affected by inflation.
Limitations of the Equilibrium Model
It assumes competitive markets with many buyers and sellers, which is not always true.
It assumes rational behaviour and good information.
It often ignores externalities, such as pollution, and market power.
Real markets are constantly adjusting and rarely sit exactly at equilibrium.
Market equilibrium is where demand meets supply and the market clears. You find it by setting quantity demanded equal to quantity supplied, and you understand it by seeing how surpluses and shortages push prices back to that point. It also gives managers a way to think through pricing, forecasting and policy shocks, with a clear view of what the model does and does not capture.
If you want to go deeper into microeconomics, macroeconomics and econometrics, the Symbiosis SSODL Online M.Sc. in Economics is a 24-month live online programme for graduates with at least 50% marks. Its curriculum includes mathematical economics, public economics, advanced microeconomics and macroeconomics, econometrics and research methodology, with a specialisation in development studies. The programme is entitled by the UGC and approved by AICTE. Check the programme page for current fees and admission details.
Frequently Asked Questions
Market equilibrium is the state in which the quantity buyers want to purchase equals the quantity sellers want to supply at a given price, so the market clears with no shortage or surplus.
In economics, it is the point where the demand and supply curves intersect. The price at that point is the equilibrium price and the quantity is the equilibrium quantity.
Set quantity demanded equal to quantity supplied, solve for the price and substitute the price back into either equation to find the quantity. You can also read it from a schedule or a graph.
It is the price at which quantity demanded equals quantity supplied. It is the only price at which the market clears.
Above equilibrium, there is a surplus and the price tends to fall. Below equilibrium, there is a shortage and the price tends to rise, until the market returns to equilibrium.
Shifts in demand or supply, driven by factors such as income, tastes, input costs, technology, expectations and government policy.
Stable and unstable, partial and general, static and dynamic, and short-run and long-run equilibrium. Equilibrium also differs across market structures such as perfect competition and monopoly.
It underpins pricing, demand forecasting, competitive strategy and policy analysis, helping managers predict how markets respond to changes in costs, demand and regulation.
Arif Siddiqui
Head of Accounting and Treasury
Arif Siddiqui is a finance leader specializing in accounting, treasury, and financial strategy. As Head of Finance at Generali Employee Benefits, he brings extensive experience in managing global financial operations. He is known for driving financial efficiency and governance across organizations. His leadership supports sustainable business growth and financial excellence.
Get Free Upskilling Guidance
Fill in the details for a free consultation
Find a Program made just for YOU
We'll help you find the right fit for your solution. Let's get you connected with the perfect solution.

 October 26, 2026
 8 min read





 Key Insights
 ChatGPT
 Perplexity
 Claude
 Grok
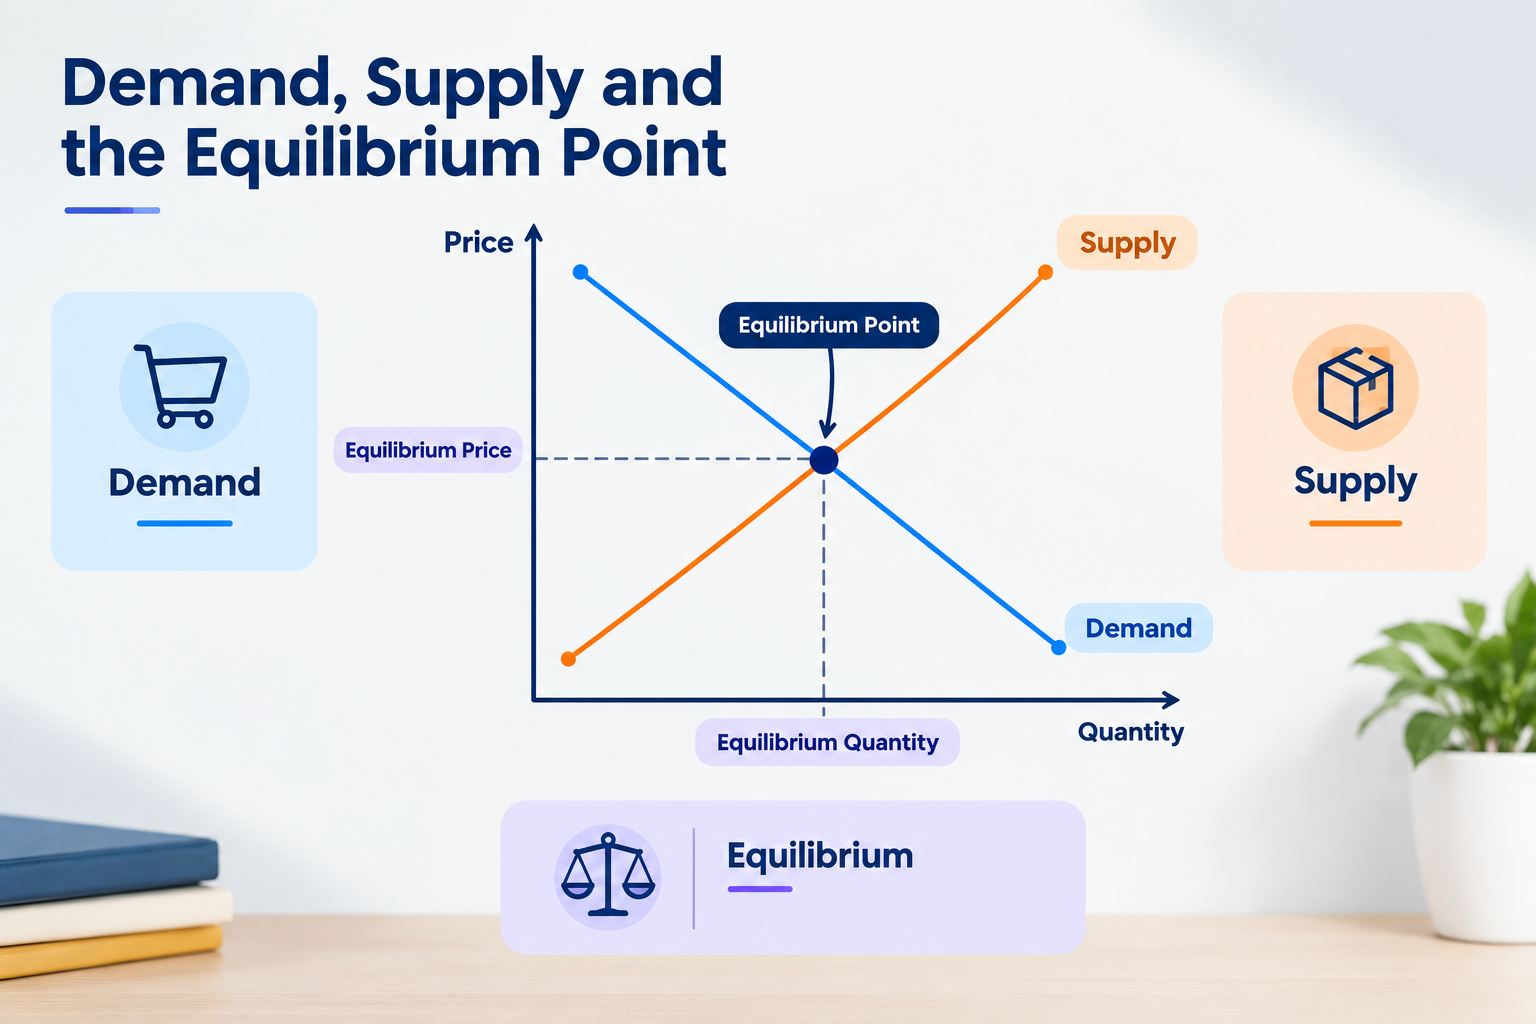 Equilibrium is built from two forces. Demand shows how much buyers want at each price, and as price rises, quantity demanded generally falls. This reflects diminishing satisfaction from each extra unit, an idea explained in our guide to total and marginal utility. Supply shows how much sellers offer at each price, and as price rises, quantity supplied generally rises because production becomes more profitable.






 ROI Calculator