Different Types of Data Explained With Simple Examples
J
By Dr. Sanjay Kulkarni
January 31, 20268 min read
Last updated on March 18, 2026
SHARE THIS ARTICLE
Table Of Content
What is Data?
Why Types of Data Matter in Data Science?
What Are the Different Types of Data?
Difference Between Nominal and Ordinal Data
Did you know that Data is silently operating in the background from the time you unlock your phone in the morning until you stream a movie or make an online payment? Every click, swipe, message, and purchase generates data that businesses, apps, and platforms use to make smarter, more informed decisions.
But here, the real challenge is how experts actually comprehend this vast volume of data.
This is where understanding the different types of data is essential for choosing the right analysis strategies and drawing accurate conclusions. The four types of data are nominal, Ordinal, Discrete, and Continuous. In this blog, we are going to talk about each of these data types with examples. Stay tuned to learn more.
Also, if you want to know more about data analysis, check out Jaro Education online courses. You can also improve your knowledge in AI, ML, Python, and SQL, and gain practical insights and hands-on experience.
What is Data?
In the simplest terms, data is information that can be collected, stored, and analysed to make decisions. Consider your daily lifestyle. Even if you don’t call it that, data is all around you. For instance:
A student who received a test score of 90 out of 100
The hue of your vehicle
The outdoor temperature of your house
Your fitness tracker’s step count
Each of these is a data point. However, they are not the same types of data, and that difference matters a lot in data science.
In data science, how data is processed, analysed, and visualised depends heavily on its type. Treating all data the same can lead to wrong insights, flawed models, and poor business decisions.
Understanding various types of data helps professionals:
Choose the right statistical techniques
Apply suitable machine learning algorithms
Visualise information correctly
Avoid costly analysis errors
Why Types of Data Matter in Data Science?
Data types are the foundation of data analysis, determining how data should be acquired, stored, analysed, and visualised.
When different types of data are misunderstood, analysis might become useless, such as attempting to compute the average hair colour or arranging cities by eye colour.
Different types of data exist because information serves various functions in real-world analysis.
Gender, nationality, product categories, and client segments are some of the major types of data utilised to categorise information.
Other Types of data used to measure quantities include height, weight, revenue, temperature, and time.
Analysts can rate or compare values like customer satisfaction, exam marks, and performance ratings.
Some data formats are necessary for spotting patterns and projecting trends, such as monthly sales figures.
Some data types are essential for identifying patterns and predicting trends, such as monthly sales figures or website traffic over time.
What Are the Different Types of Data?
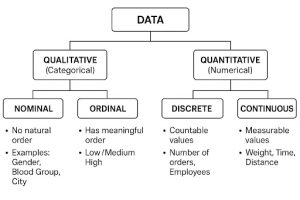
There are two broad categories into which all types of data will fall: Qualitative Data and Quantitative Data. It’s imperative to understand these types of classifications because each type has different ways of being assessed, viewed and interpreted. So let’s take a closer look at these types.
1. Qualitative or Categorical Data
Qualitative data, often known as categorical data, consists of qualities, characteristics, or attributes that cannot be expressed using numbers. Rather than measuring values, this type of data classifies information into distinct groups or categories. It focuses on describing what kind of data something is, not how much or how much.
Qualitative data can appear in many forms, including:
Text, such as written responses or feedback
Images, like photographs or icons
Audio, such as recorded interviews or voice notes
Symbols, including labels or identifiers
Common examples of qualitative data include gender, eye colour, language spoken, food preferences, opinions, and brand choices. Since this data does not involve numerical values, it cannot be averaged or used in mathematical calculations.
Businesses rely heavily on qualitative data to gain deeper insights into:
Customer preferences and customer behaviour
Brand perception and reputation
User experience and satisfaction
Market trends and consumer sentiment
The Qualitative Data Are Further Classified Into Two Parts
A. Nominal Data
Nominal data is the simplest type of qualitative data. It is used to label or name categories that are not ordered, ranked, or hierarchical. The term nominal is derived from the Latin word nomen, which means “name,” and clearly indicates its purpose: designating categories.
In nominal data, there is no notion of one value being more or less than another. For example, hair colour and nationality cannot be ordered or compared numerically.
Examples of nominal data include:
Hair colour (Black, Brown, Blonde)
Gender (Male, Female, Others)
Marital status (Single, Married)
Nationality (Indian, American, British)
Eye color
Nominal data is widely used in:
Surveys and questionnaires
Demographic studies
Customer segmentation and profiling
B. Ordinal Data
Ordinal data is similar to qualitative types of data, but with one significant difference: it has a meaningful order or ranking. While ordinal data allows us to compare values as higher or lower, the precise intervals between categories cannot be determined.
For example, “Very Happy” is better than “Happy,” but there is no way to quantify how much better it is.
Here’s the major difference between Nominal and Ordinal data:
Basis of Comparison
Nominal Data
Ordinal Data
Definition
Nominal data is used to name or label categories without any logical order or hierarchy.
Ordinal data represents categories that follow a clear and meaningful order or ranking.
Order or Ranking
There is no order or ranking among the categories.
Categories have a defined order or sequence.
Nature of Data
It is purely categorical and used only for identification purposes.
It is ordered categorical data, combining categorisation with ranking.
Comparison Between Values
Values cannot be compared as higher or lower.
Values can be compared and ranked based on position.
Mathematical Operations
Mathematical or arithmetic operations cannot be performed.
Arithmetic operations are still not meaningful, but ranking is possible.
Interpretation
These types of data focus on identifying differences between categories.
Focuses on identifying relative position or level among categories.
Use in Analysis
Used for grouping, classification, and segmentation.
Used for ranking, ordering, and preference analysis.
2. Quantitative Data
Quantitative data is information in numerical form that is used to measure quantities. Unlike qualitative data, it answers questions like how much, how many, and how frequently. This makes it indispensable for statistical analysis, forecasting, and machine learning models.
Examples of quantitative types of data are:
Height and Weight
Temperature
Test scores
Time Duration
Because quantitative data is numerical, it may be analysed using mathematical formulas and represented using charts such as bar charts, line graphs, histograms, and scatter plots.
The Quantitative Data Are Further Classified Into Two Parts
A. Discrete Data
Discrete data consists of countable values that can be represented as whole numbers. These values cannot be broken down into smaller quantities or stated as decimals.
Examples of discrete data are:
Number of students in a class.
Number of employees in a company.
Total number of days in a week
Total goals scored in a match.
Discrete data is frequently represented as bar graphs or frequency tables and is widely used in operational and performance analyses.
B. Continuous Data
Continuous data are quantifiable quantities that can take any value within a specified range, including decimals and fractions. This form of data is measured instead of being counted.
Examples of continuous data are:
The height of an individual
Speed of a vehicle
Time required to finish a task
Temperature
Histograms and line graphs are the most effective ways to visualise continuous data, particularly for analysing trends or fluctuations across time.
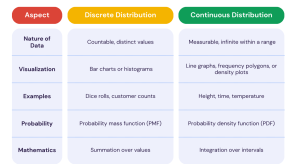
Difference Between Discrete and Continuous Data
*datasciencedojo.com
The table below represents the difference between Discrete and Continuous data:
Basis of Comparison
Discrete Data
Continuous Data
Nature of Data
Discrete data consists of distinct and separate values. Each value is clearly defined and stands on its own.
Continuous data consists of values that flow smoothly within a range and are not restricted to fixed points.
Countable vs Measurable
It is countable, meaning values are obtained by counting items or events.
These types of data are measurable, meaning values are obtained through measurement using instruments or scales.
Type of Values
Discrete data includes whole numbers or integers only.
Such data types allow decimal and fractional values, providing higher precision.
Subdivision of Values
Values cannot be divided into smaller, meaningful units.
Values can be divided infinitely into smaller and more precise units.
Data Representation
It is best represented using bar graphs, frequency tables, or count plots, with gaps between values.
Continuous data is best represented using histograms, line graphs, or density plots, where values form a continuous flow.
Number of Possible Values
Discrete data has a finite or countable number of possible values within a given range.
It has infinite possible values within a given range.
Precision Level
Discrete data has limited precision because values jump from one whole number to the next.
It offers high precision due to the use of decimals and measurements.
How You Can Grow Your Data Expertise
If you want to be a data expert, here are a few easy tips to follow:
1. Create a Solid Foundation in Data Concepts
Understand the basic concepts of data theory. These include types of Data: Nominal, Ordinal, Continuous, and Discrete; Statistics; Data Visualisation (Graphs and Charts). By knowing these basic principles, you will be able to better assess how to interpret a given piece of data, and you will have more options when determining the best way to analyse it.
2. Learn Essential Tools and Programming Languages
Next, you should learn to work with the most commonly used programming languages and tools in data analysis. They are: Python, R, SQL, and Excel. Visual Analytics Software Tools include Tableau, Power BI, and Google Data Studio. These languages and tools will give you hands-on experience analysing and visualising data, and provide insights to transform raw numeric data into valuable insights.
3. Work on Real-World Projects
Once you understand the above concepts and have learned to use them, begin creating your own real-world projects using methods for analysing data: Sales Reports, Customer Reviews, and Web Analytics. Working on these projects will allow you to gain greater experience and hone your knowledge.
4. Take Online Courses and Certifications
The best way to hone your knowledge and make your resume stand out is by taking online courses and certifications. For example, the PG Certificate Programme in Applied Data Science AI-IIT Roorkee through Jaro Education can help you analyse various types of real-world datasets and produce actionable insights for application in the economy, business, and society.
5. Participate in Data Challenges and Collaborate
Participate in Kaggle competitions, hackathons, and community projects to test your abilities in real-world settings through collaboration. Working with other data professionals can help you gain knowledge and expertise about real-world challenges while getting constructive feedback on your work from someone else.
The Bottom Line
Understanding different forms of data is a critical ability in data science and analytics. Whether it be nominal data, ordinal data, discrete data, or continuous data, each type has a distinct role in analysis and decision-making.
If you want to pursue a career in data science, learning these principles is the first step. Good foundations lead to good careers, which all begin with an awareness of facts.
Frequently Asked Questions
The two main types of data are qualitative data and quantitative data.
Nominal data is categorical data without any order or ranking, such as gender or eye colour.
Ordinal data has a meaningful order but no measurable difference between values, such as rankings or satisfaction levels.
Discrete data is countable and whole-number-based, while continuous data is measurable and can include decimals.
Dr. Sanjay Kulkarni
Data & AI Transformation Leader
Dr. Sanjay Kulkarni is a Data & AI Transformation Leader with over 25 years of industry experience. He helps organizations adopt data-driven and responsible AI practices through strategic guidance and education. With experience across startups and global enterprises, he bridges the gap between theory and real-world application. His work empowers teams to innovate and thrive in AI-driven environments.


 Admission Open
 Admission Open
 Admission Open


